Home
SQL Size online help Prev Page Prev Page
Introduction
About SQL Size
Version history
Contact us
User Guide
Architecture
Licensing
Installation
System requirements
Reference Guide
The SQL Size Agent service
The SQL Size Configuration application
SQL Server instances
Data collection schedule
Reports and emails
Report template
Data storage
Alerts
Script editor
Useful shortcuts
Activating your license
The SQL Size database
The SQL Size GUI
The Overview page
Export overview
Database analysis
Alerts history
Error history
Scripting
Data types
Script structure
Language basics
Debugging
Global variables
Functions
Alert functions
RaiseAlert
RaiseConditionalAlert
AddAlertDetails
Mathematical functions
Power
String formatting functions
FormatBytes
FormatFloat
Support functions
String functions
Date and time functions
Date-Time format strings
Class reference
TBaseClass
Properties
AverageDailyGrowth
Name
ObjectType
Size
SizeDesc
Tag
TInstance
Properties
Database
DatabaseByName
DatabaseCount
DatabaseDataSize
DatabaseExists
DatabaseFilestreamSize
DatabaseLogSize
DatabaseSize
PathCount
Path
TDatabase
Properties
DataSize
DBFile
DBFileCount
Filegroup
FilegroupCount
FilestreamSize
LogSize
TFilegroup
Properties
DBFile
DBFileCount
FilegroupType
TDBFile
Properties
Filegroup
FileType
Growth
IsPercentGrowth
MaxSize
Path
PhysicalName
TPath
Properties
FreeSpace
Enumerations
TFileType
TFilegroupType
TObjectType
Records
TGrowthStats
Constants

Database analysis

The top area of the database analysis page displays the growth trend of the database in total, the data files, the transaction logs, and the filestream data, for the selected period.

sqlgui_total_11  

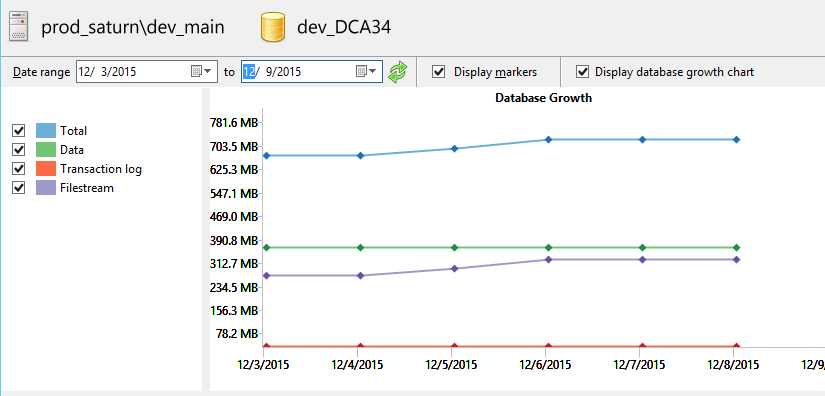
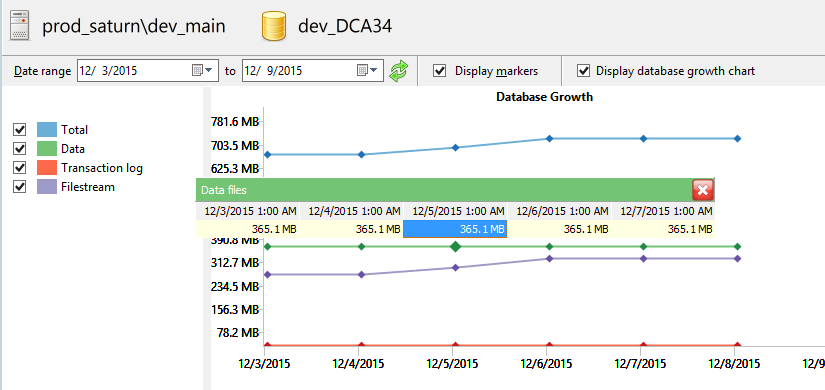
You can display the actual size of each data point by clicking on the marker in the chart. Values for the previous 2 and subsequent 2 data points are also displayed for comparison purposes.


sqlgui_total_12  

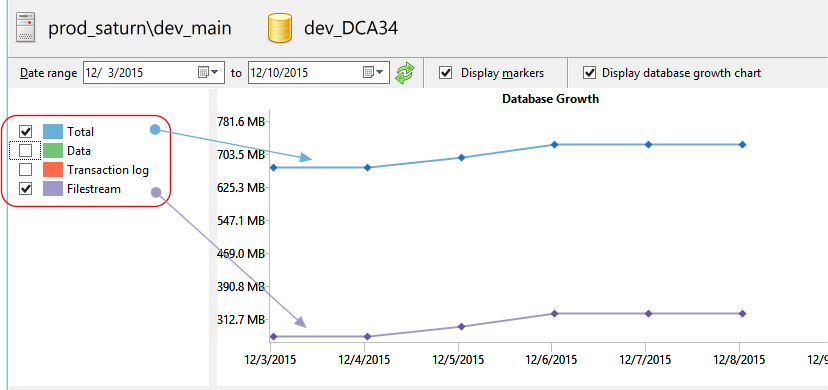
To hide any of the components, uncheck the corresponding component on the left pane.

sqlgui_total_13  


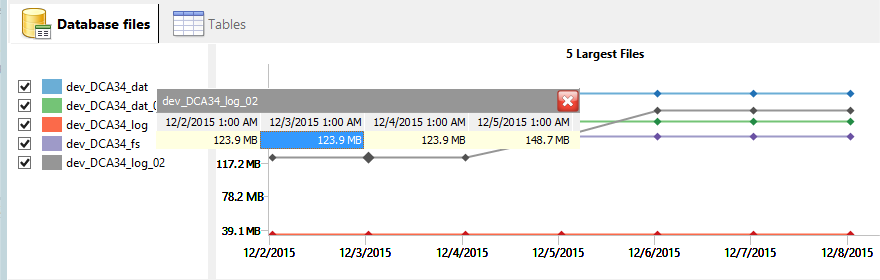
The bottom area of the database analysis page displays the growth trend of the individual database files and tables. Only the trend for the 5 largest database files are displayed on the chart, and only size details for the 20 largest tables are displayed.


Database files

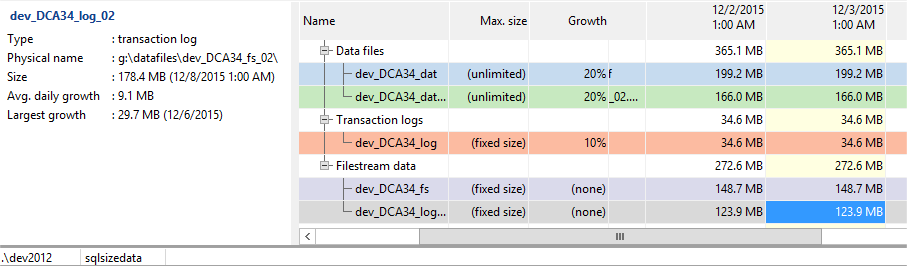
The Database files page displays the growth trend of the largest 5 database files for the selected period. Clicking on any of the data points in the chart will display the values for that data point. The corresponding item in the details window will also be selected.

sqlgui_elements2_01  


The details window displays the values collected for all the database components (data files, transaction logs, and filestream data) for the selected period. The left panel displays details of the selected component, including the average growth and largest growth for the selected period.

sqlgui_elements3_02  


Tables

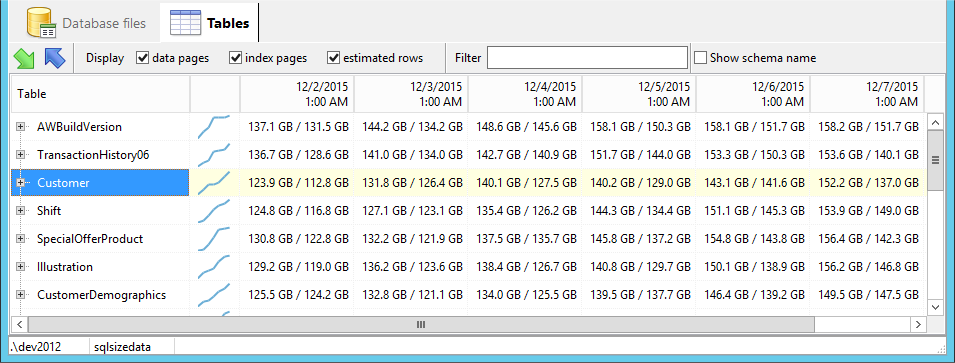
The Tables page displays the size of the largest 20 tables for the selected period. A trend chart is also displayed for each of the tables.

sqlsize_tables_01  

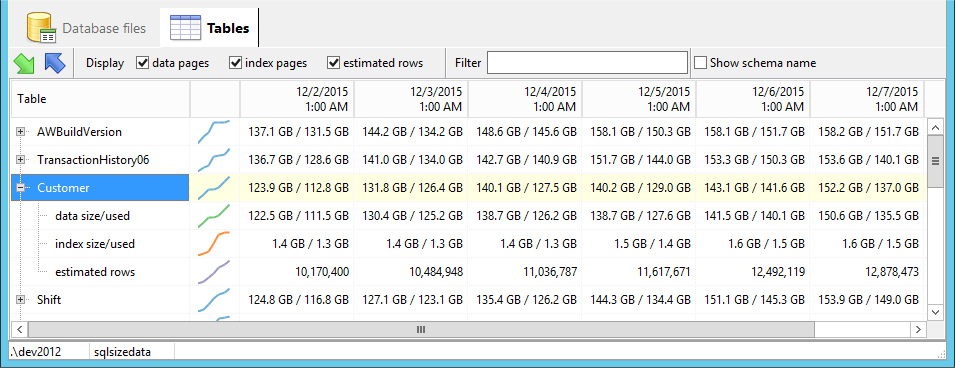
You can also see the breakdown between the space occupied by data pages and index pages by expanding each table's node. An estimate of the number of rows in each table is also displayed.

sqlgui_tables2_02