
Copyright © 2005 - 2023 Yohz Software, a division of Yohz Ventures Sdn Bhd. ALL RIGHTS RESERVED
.All trademarks or registered trademarks are property of their respective owners

Easy Excel
Analysis
Data analysis made easy
Use analysis tables and pivot tables to reveal trends and patterns.
Share your discoveries
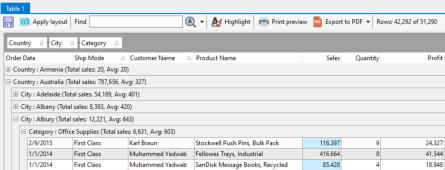
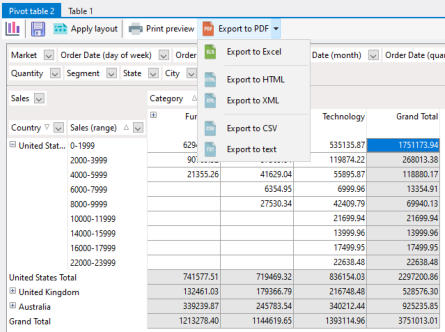
Print and export your analysis tables and grids to multiple formats, inclusing Excel, HTML, XML, and text files.
Import Excel and CSV files
Import data from single or multiple Excel and CSV files, and customize the import process to your requirements.
Data analysis made easy with analysis tables
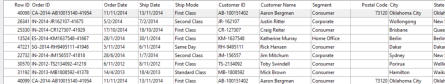
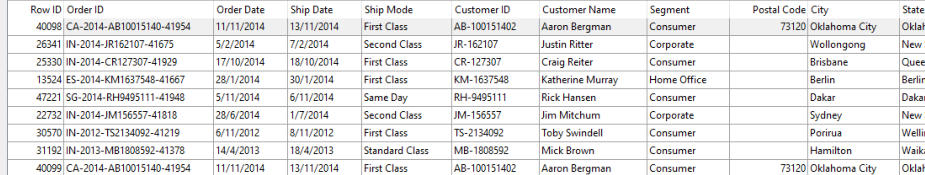
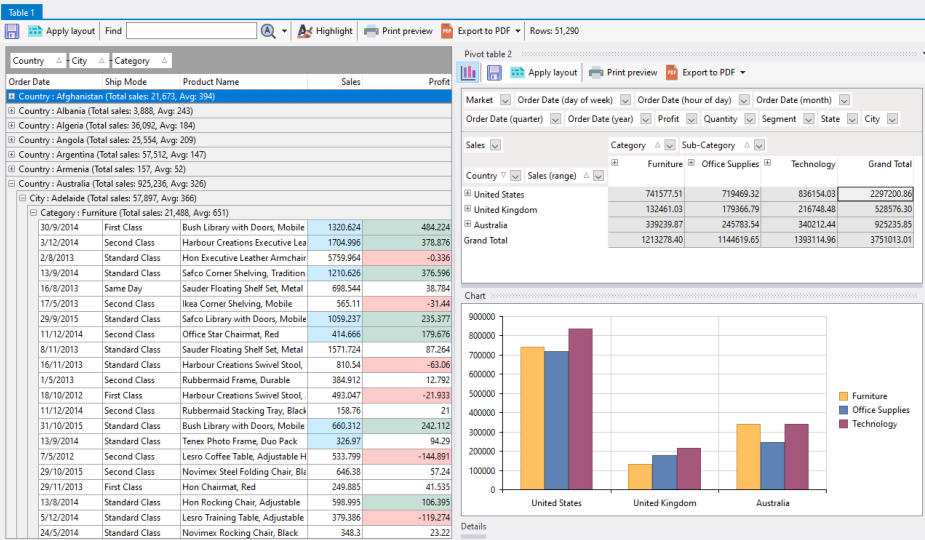
Use analysis tables to sort, filter, group, and summarize your data whichever way YOU need. Transform this:
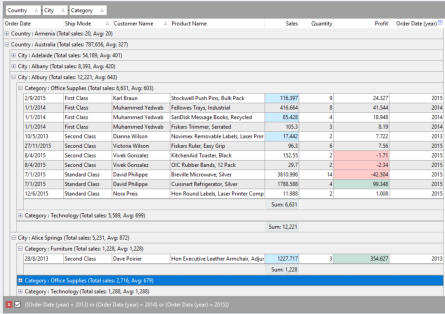
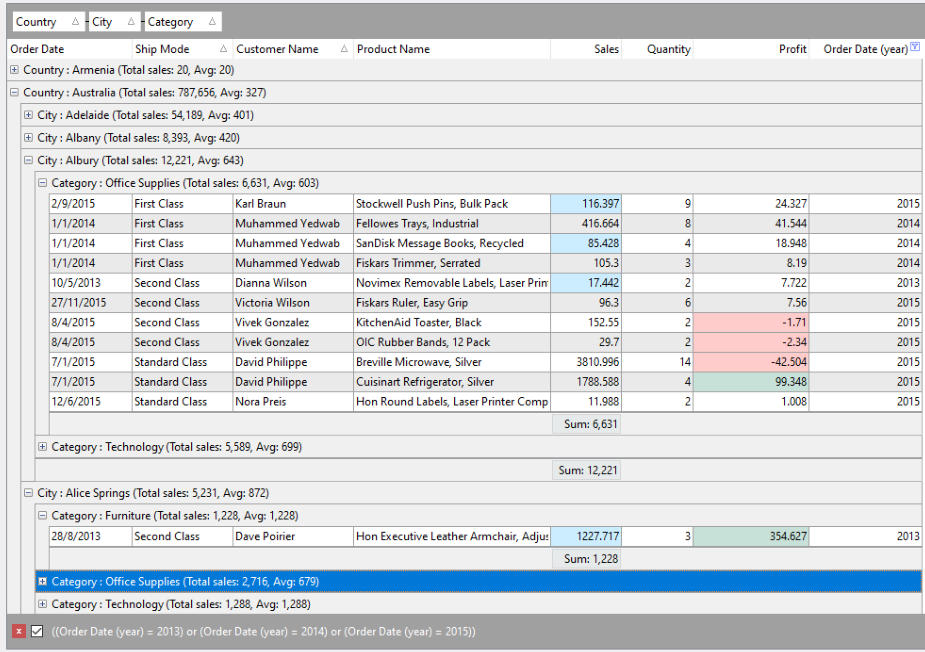
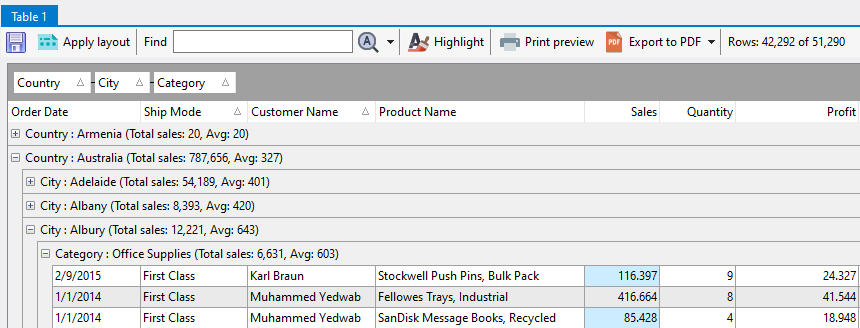
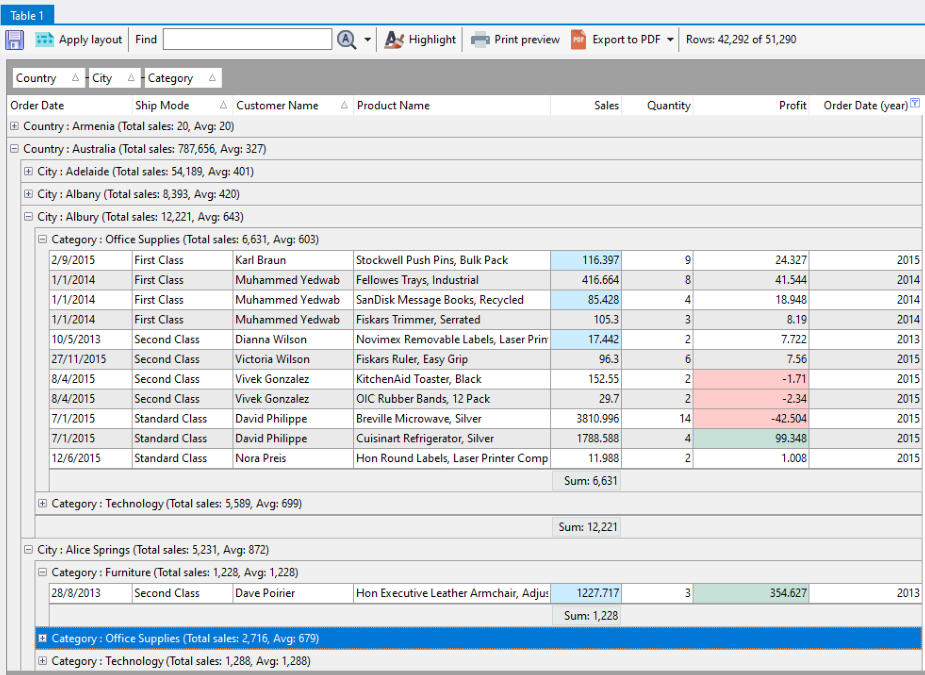
into this:
Grouping
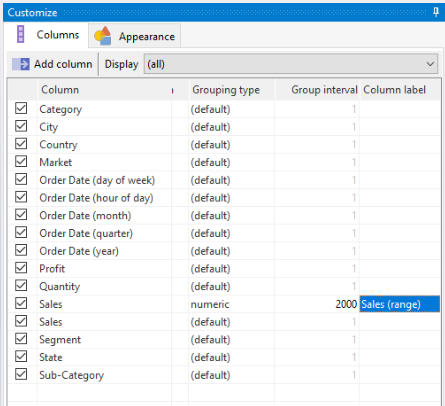
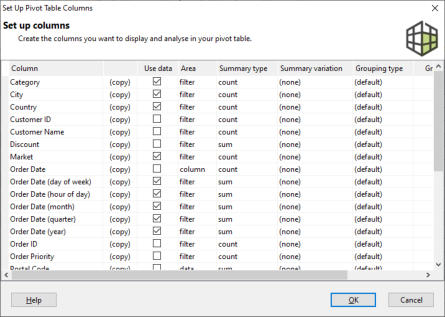
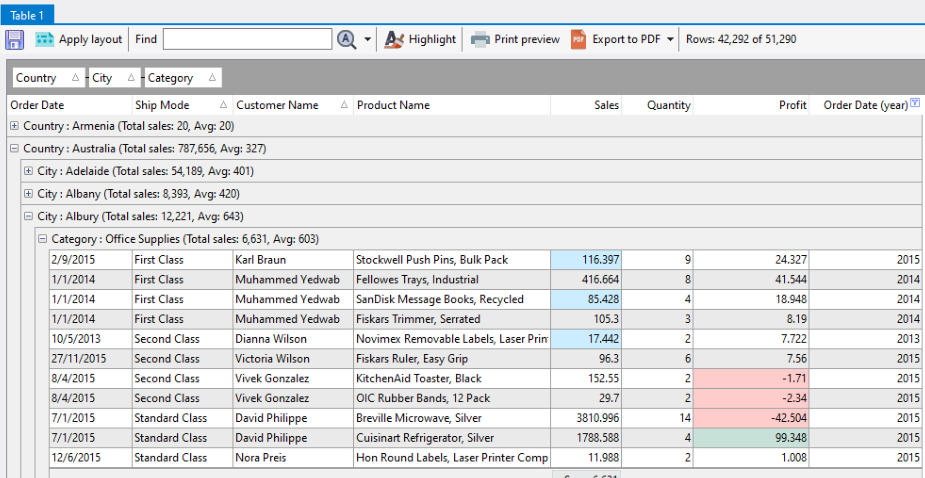
You can group columns in whichever order you require. This allows you to summarize your data in many possible ways, potentially uncovering new information or patterns.Summaries
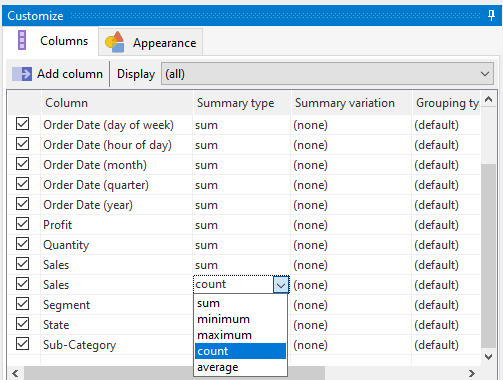
Create summaries for any columns, or even multiple summaries for the same column using different functions. View summaries in group headers, group footers, and column footers.Conditional highlighting
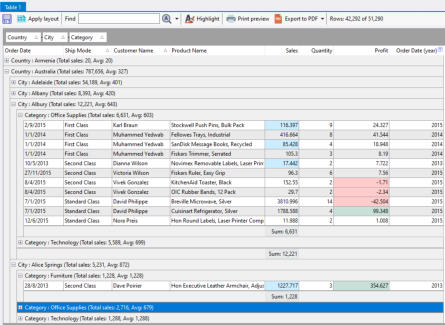
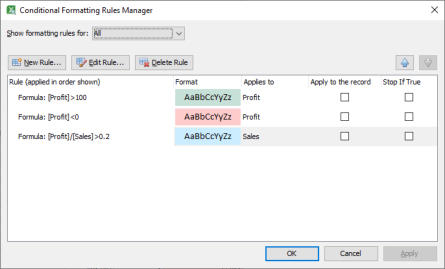
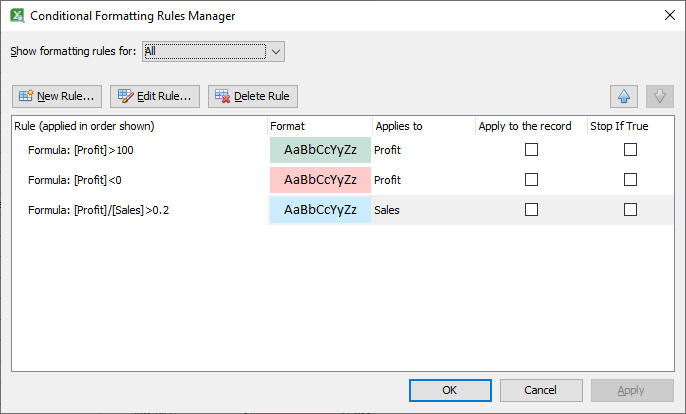
Highlight exceptional values using flexible rules and formulas.Sorting
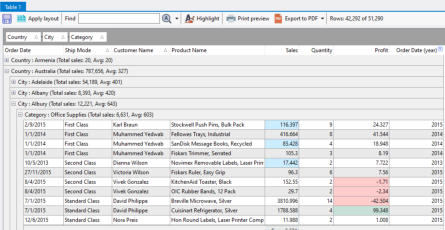
Sort one or more columns in ascending or descending orders, in the sequence you require. In our example, the data is first sorted by Ship Mode, then by Customer Name. The groups (Country, City, Category) are also currently sorted in ascending order.Filtering
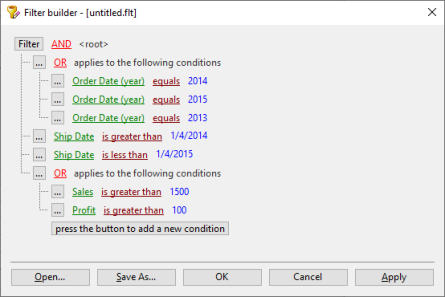
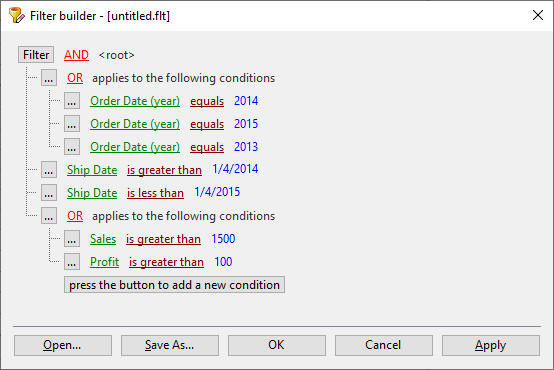
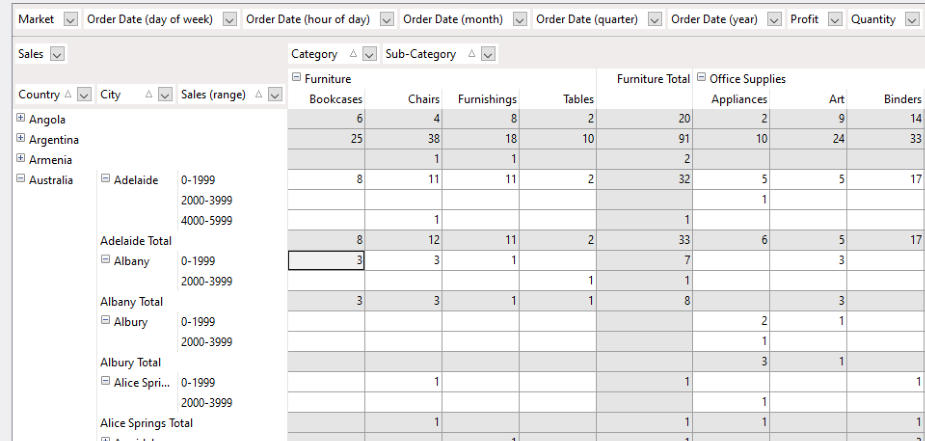
Each column can be filtered to display only the data you want to see. You can also apply more complex filtering rules.Pivot tables - new dimensions revealed
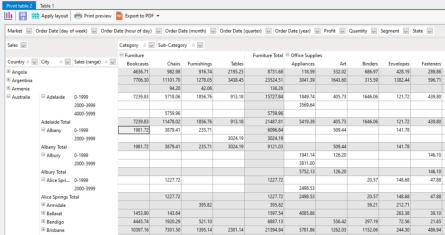
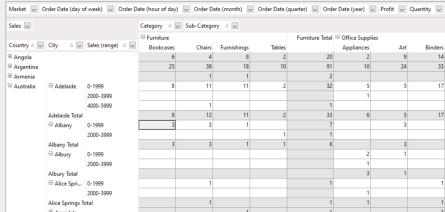
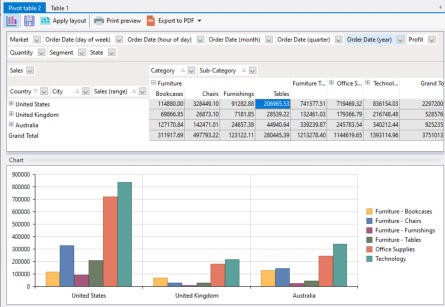
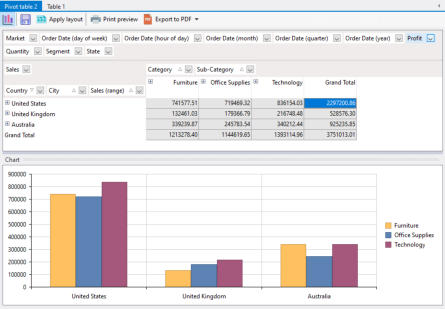
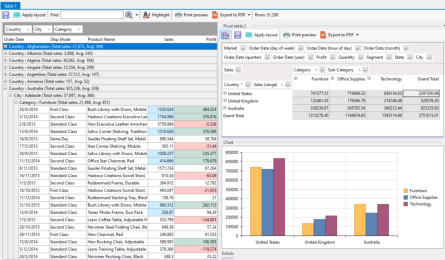
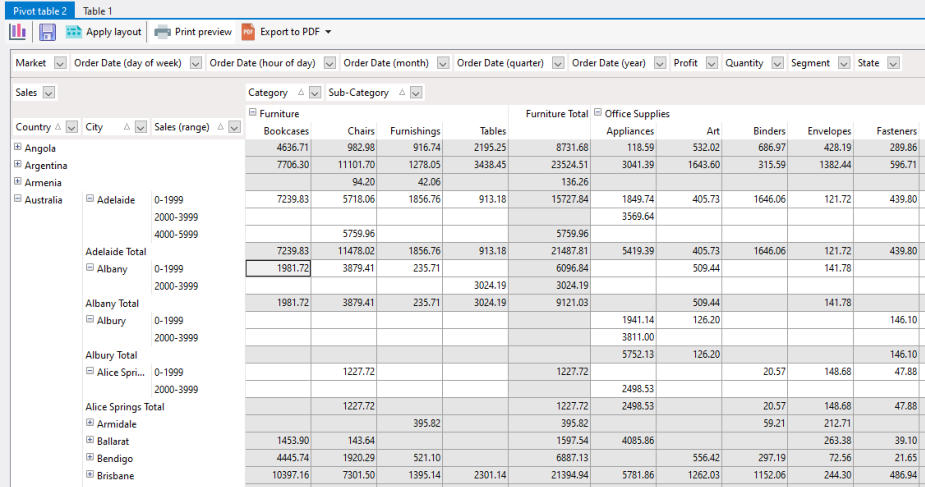
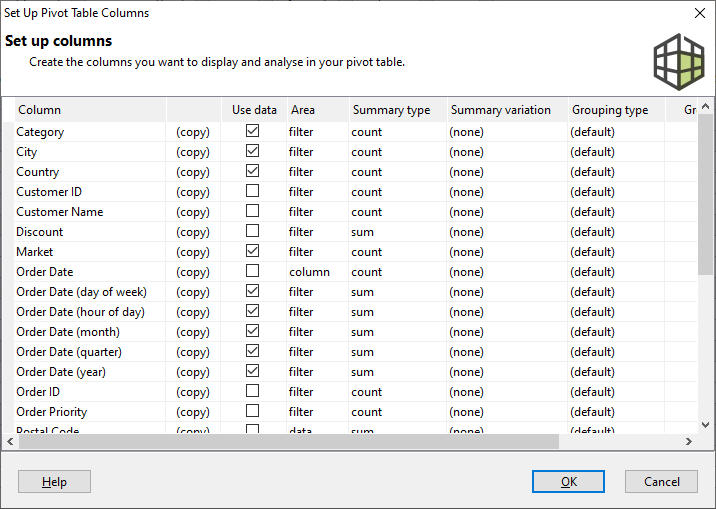
Use pivot tables to analyse your data across various dimensions to gain new insights into your business.
Flexible summaries
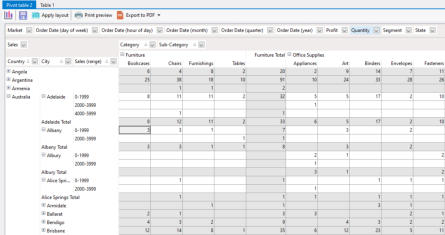
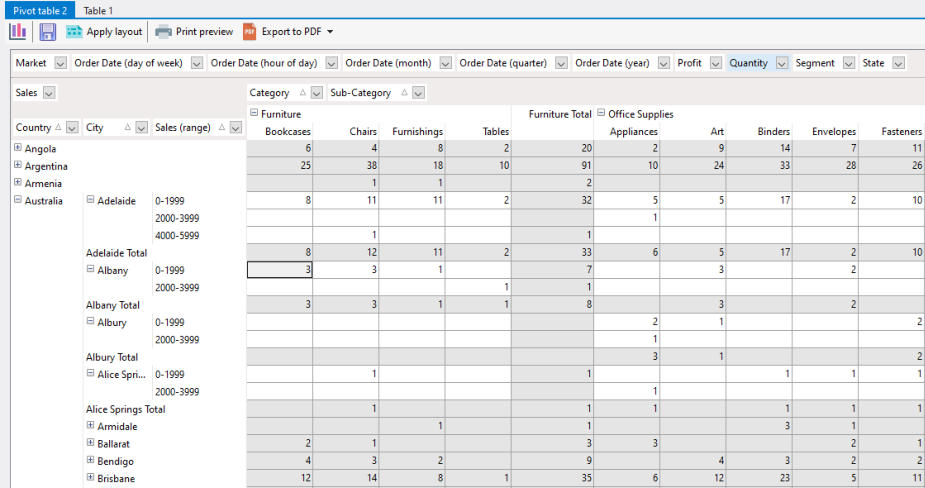
Switch summary types just by selecting the function you want, and the pivot table will display your changes immediately.Flexible dimensions
Create as many dimensions as you require to analyze your data. Arrange those dimentions in rows or columns to make new discoveries.Flexible grouping
Group your dimensions’ values using values that help you uncover new trends and patterns.
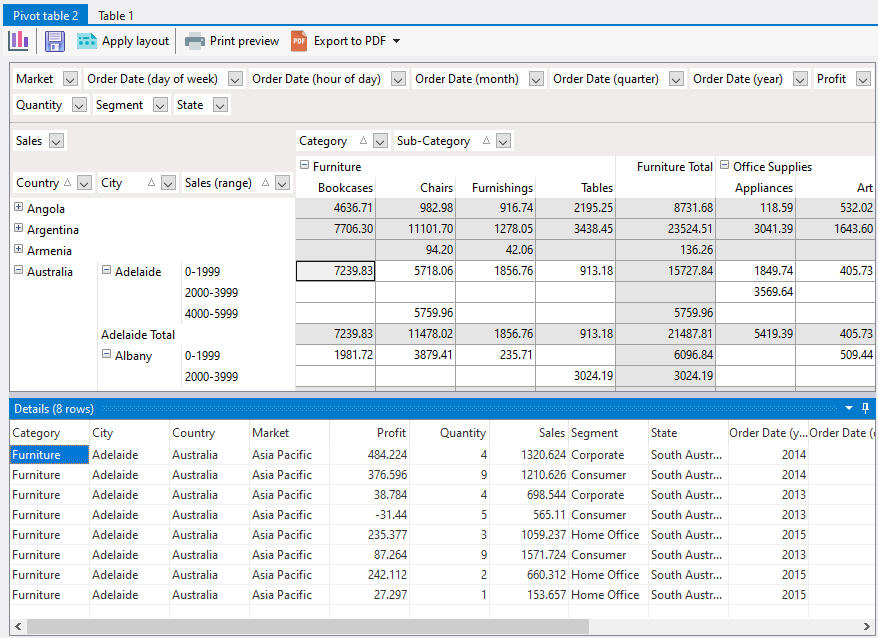
Never lose track of your details
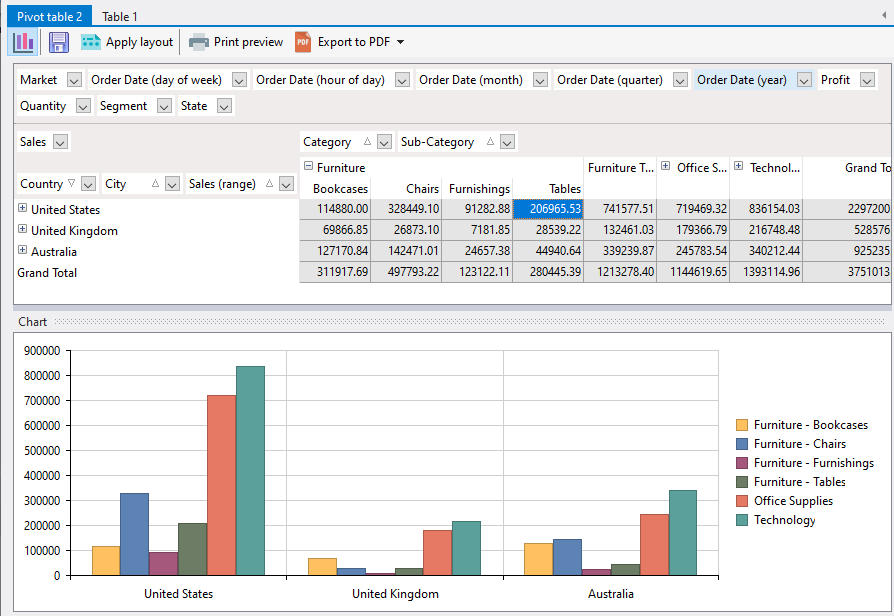
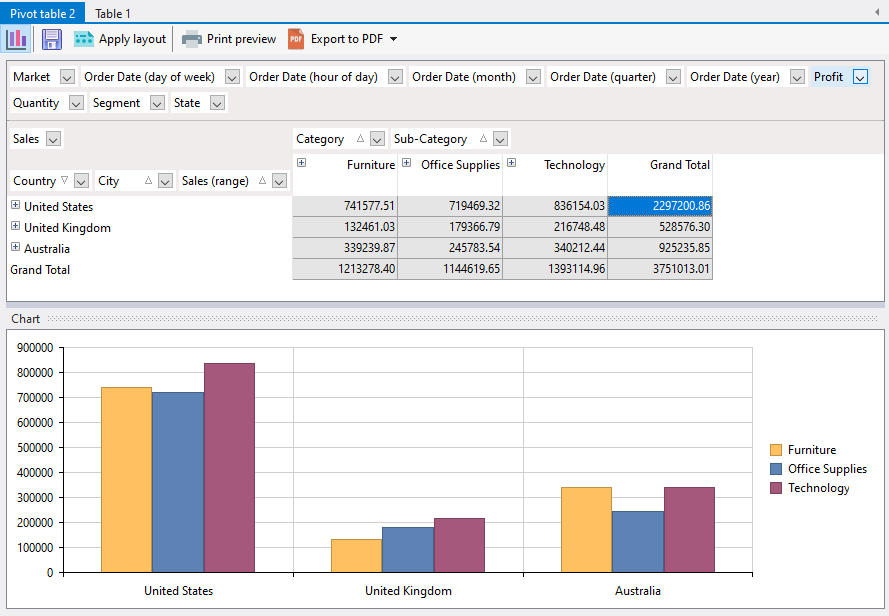
While slicing and dicing your data, you still have full access to the underlying transactional data that makes up your summaries.Visualize using charts
For high-level summaries, you can use charts to quickly compare trends and changes. Charts will change their display depending on you change the layout of the pivot table.Print and export
Print and export your analysis and pivot tables to multiple formats to share your insights.
Customizable layout
Arrange the analysis tables, pivot tables, and charts any which way you like.
Product video


Copyright © 2005 - 2023 Yohz Software,
a division of Yohz Ventures Sdn Bhd.
ALL RIGHTS RESERVED
.All trademarks or registered trademarks are property of their respective owners

Data analysis made easy with
analysis tables
Use analysis tables to sort, filter, group, and summarize your
data whichever way YOU need. See how you can transform
this:
into this:
Grouping
You can group columns in whichever order you require. This allows you to summarize your data in many possible ways, potentially uncovering new information or patterns.Summaries
Create summaries for any columns, or even multiple summaries for the same column using different functions. View summaries in group headers, group footers, and column footers.Conditional highlighting
Highlight exceptional values using flexible rules and formulas.Sorting
Sort one or more columns in ascending or descending orders, in the sequence you require. In our example, the data is first sorted by Ship Mode, then by Customer Name. The groups (Country, City, Category) are also currently sorted in ascending order.Filtering
Each column can be filtered to display only the data you want to see. You can also apply more complex filtering rules.Pivot tables - new dimensions
revealed
Use pivot tables to analyse your data across various
dimensions to gain new insights into your business.
Flexible summaries
Switch summary types just by selecting the function you want, and the pivot table will display your changes immediately.Flexible dimensions
Create as many dimensions as you require to analyze your data. Arrange those dimentions in rows or columns to make new discoveries.Flexible grouping
Group your dimensions’ values using values that help you
uncover new trends and patterns.
Never lose track of your details
While slicing and dicing your data, you still have full access to the underlying transactional data that makes up your summaries.Visualize using charts
For high-level summaries, you can use charts to quickly compare trends and changes. Charts will change their display depending on you change the layout of the pivot table.Print and export
Print and export your analysis and pivot tables to multiple
formats to share your insights.
Flexible views
Arrange the analysis tables, pivot tables, and charts in the
best possible way for you to analyse your data.
Product video