Monthly Archives: March 2021

Extract PDF tables to Excel

So you need to extract data from tables in PDF files to Excel.  The first thing you need to try is to copy the data from the PDF file in your PDF reader and paste it into Excel.  It might just work.   Not if you’re using Acrobat Reader though – it’ll just appear as lines of text.  Try Foxit PDF Reader – if your table looks something like this:

copying and pasting should do the trick.  However, if your table has empty cells like this:

or is free form like this:

you’ll still end up with wrongly formatted text.

Your next option is to explore the online extraction services like PDFTables, which is quite good at extracting tables.  However, you may not be comfortable submitting your sensitive files to a third-party.  If so, consider using PdfToXls.

It’s a FREE Windows application that lets you extract data from PDF tables into Excel.  It runs on your machine, so your files stay on YOUR computer.  You define the table and column locations, and the application does the rest.

If your table layout is complex, PdfToXls provides you the tools to adjust the data easily prior to exporting it.

Download your FREE copy now.  Visit our web site for more information.  We also have a couple of videos showing the product in action.

Indexing DICOM images on your desktop

You have a collection of DICOM images from various sources, and you want to be able to search for images matching specific values in their tags.  And you don’t want to have to install an entire Apache/Cloudera Hadoop server.

Bottom line, you just want an easy way to search your collection of DICOM images.

If that’s the case, then give DICOM Search a try.  It is a Windows application (runs on Linux too via Wine). that extracts the value of each and every tag from your images and stores them into a relational database.  You then use regular SQL syntax to run your searches.

There is also a simplified syntax for those of us that don’t know SQL, where you can run searches like this easily:

It’s that simple.  Your results are displayed in a table e.g.

where you can then open the image using your favorite DICOM viewer

or use the internal viewer which displays your search results in the familiar patient/study/series hierarchy.

Imagine the possibilities when you can now search for any image in your collection using the values in the tags, on your desktop computer.

Learn more about the product on our website, or watch the introductory video here.

Download a 14-day trial of DICOM Search now and start searching your DICOM images efficiently and effortlessly to make new discoveries.

Creating an index of the DICOM image tags

A DICOM image can contain anywhere from a hundred to a thousand tags, sometimes even tens of thousands of tags.

It’s usually not an issue to search for an image matching a specific tag value on the equipment used to capture the images using the manufacturer’s software.  However, if you had a collection of images taken from different equipment, you then had to organize your images somehow in order to keep track of each image’s attributes.

Not any more.  DICOM Search is a Windows application that stores the values of each and every tag of a DICOM image into a database.  You can then search that database for images that match one or more tag values easily using SQL queries (or a simplified SQL syntax for beginners).

Basically, you have the power of a relational database engine to search your DICOM images based on their tag values.

Let’s take a closer look at DICOM Search.

Storing the image tag values

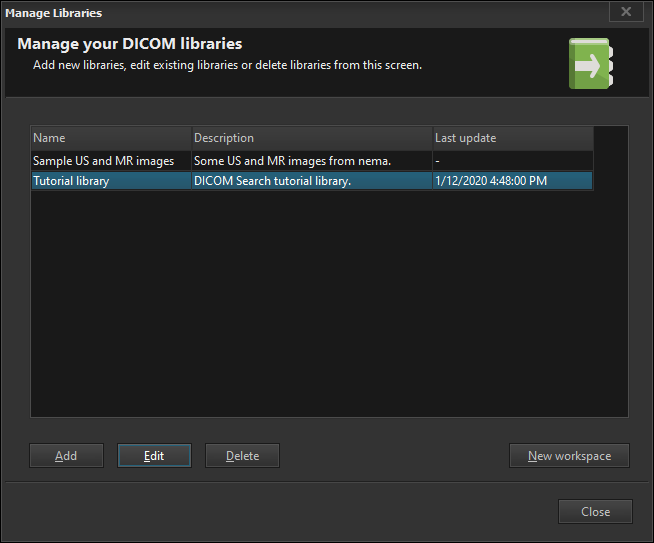
Your DICOM images are organized into libraries.  Each library can contain images from different sources, or you could just lump all images into a single library.

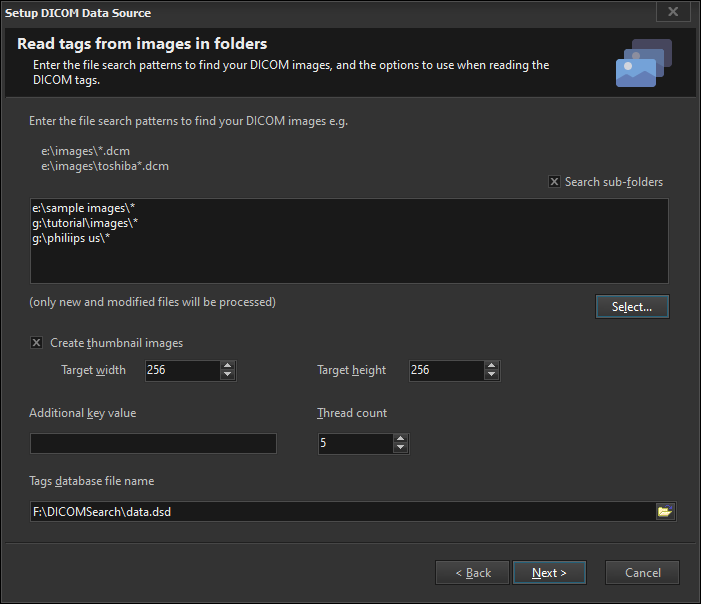
You can populate each library with images stored on your folders

or you can connect to a SQL database to retrieve the images to populate your library.

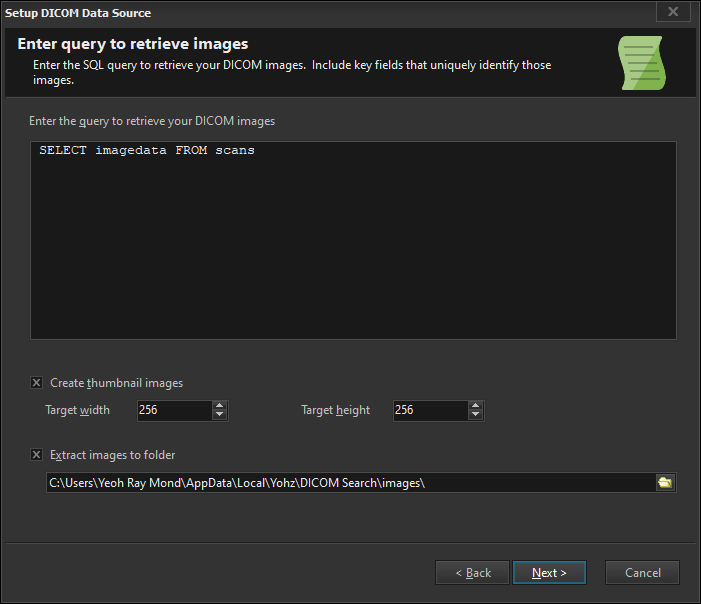
Once your images have been retrieved from your folders or from a database, each tag is then processed and stored in a database table.

Searching for images

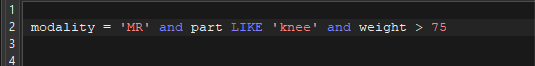
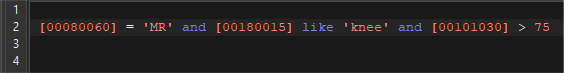
Say you want to search for MRI images of the knee where the patient weight is 75 or more.  This is how you would enter the search criteria in DICOM Search.

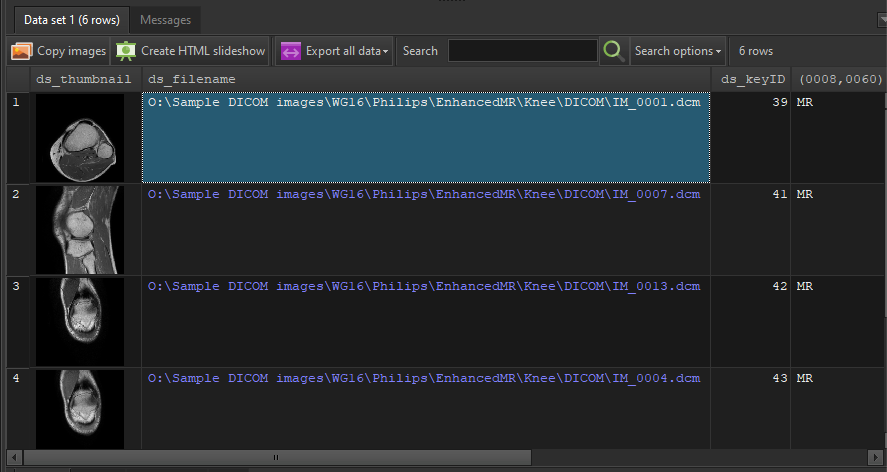
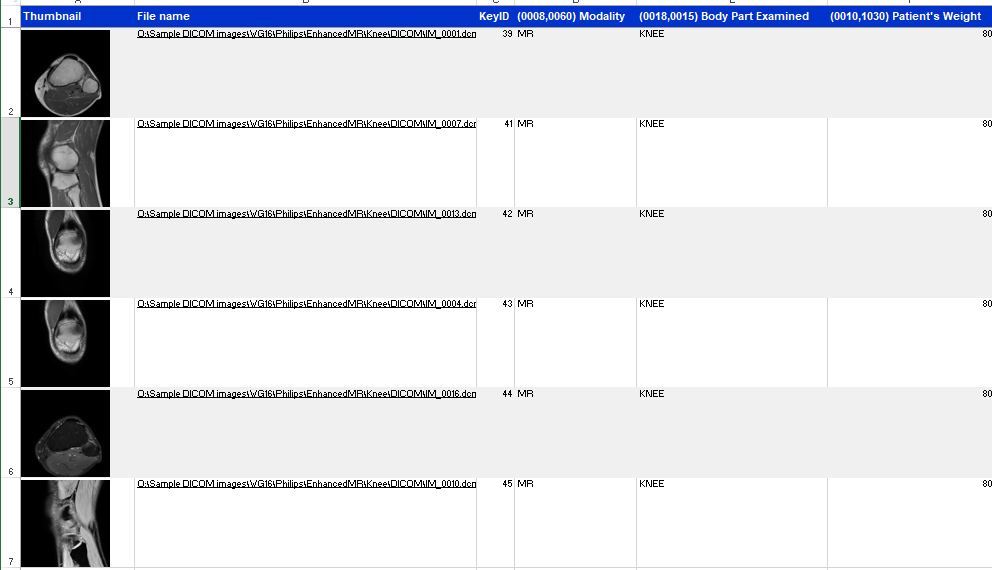
And this is how DICOM Search displays the search results.

Plain and simple.  Using tags, you can use plain words to refer to a tag, instead of the usual group and element numbers.  Of course, you can use the group/element combination if you so prefer e.g. to retrieve the same results above, you would enter:

Given that you have the power of a relational database engine under the hood, you can write some pretty advanced queries to retrieve your images.

Working with the search results

Once you have the images from your search results, here’s what you can do with them in DICOM Search:

  • copy the images to another folder, making it easier to work with just those images of interest
  • create a HTML slideshow containing those images
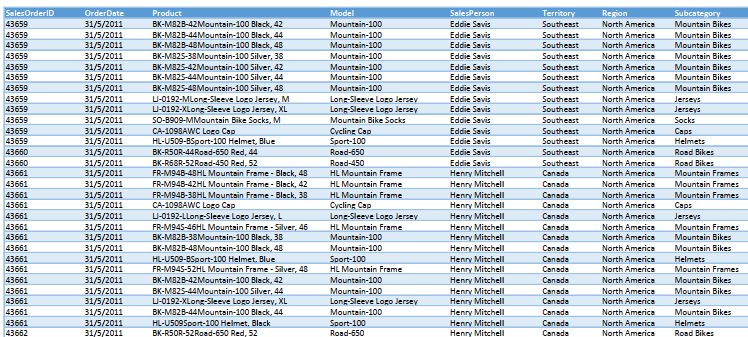
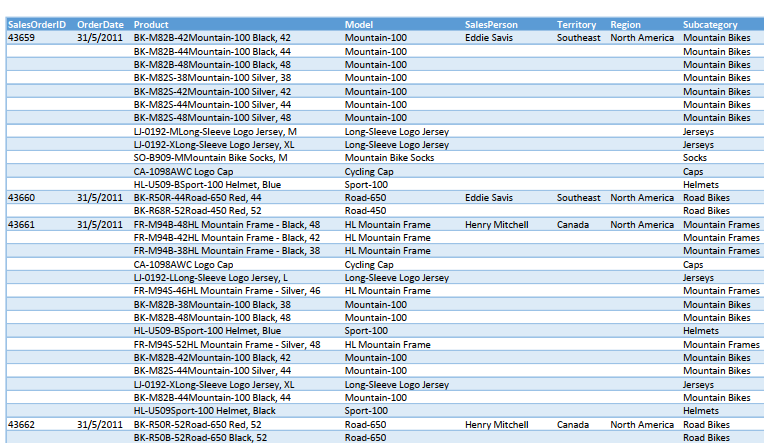
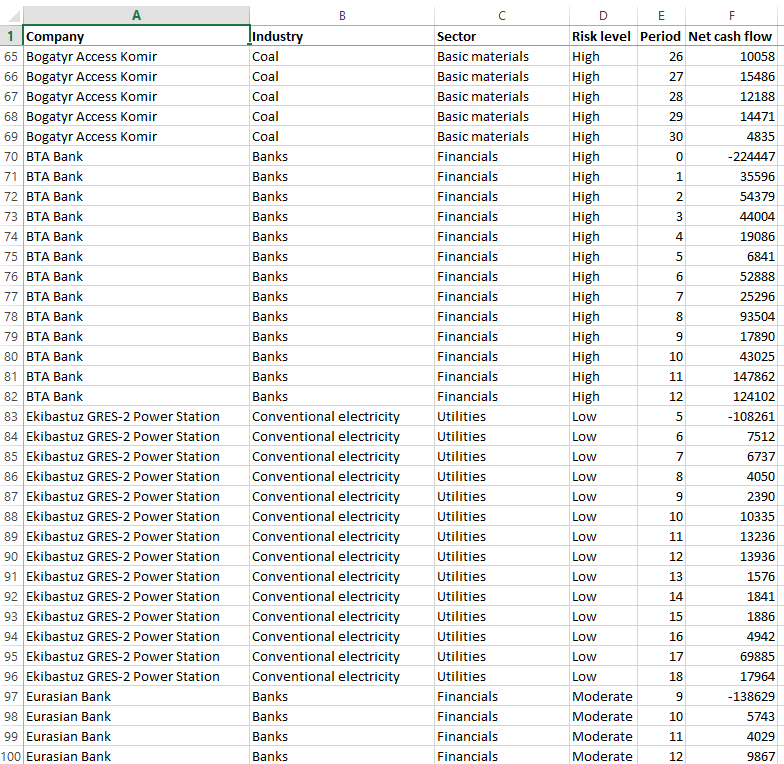
  • export the images and all the tag values in the search results into an Excel spreadsheet
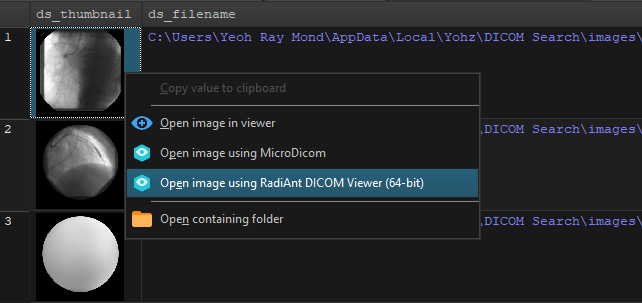
  • open the images using your preferred DICOM viewer for further analysis
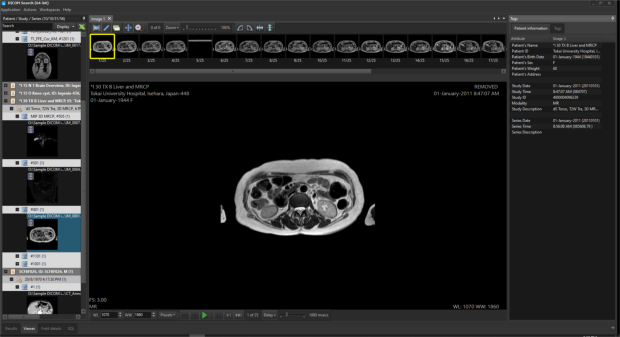
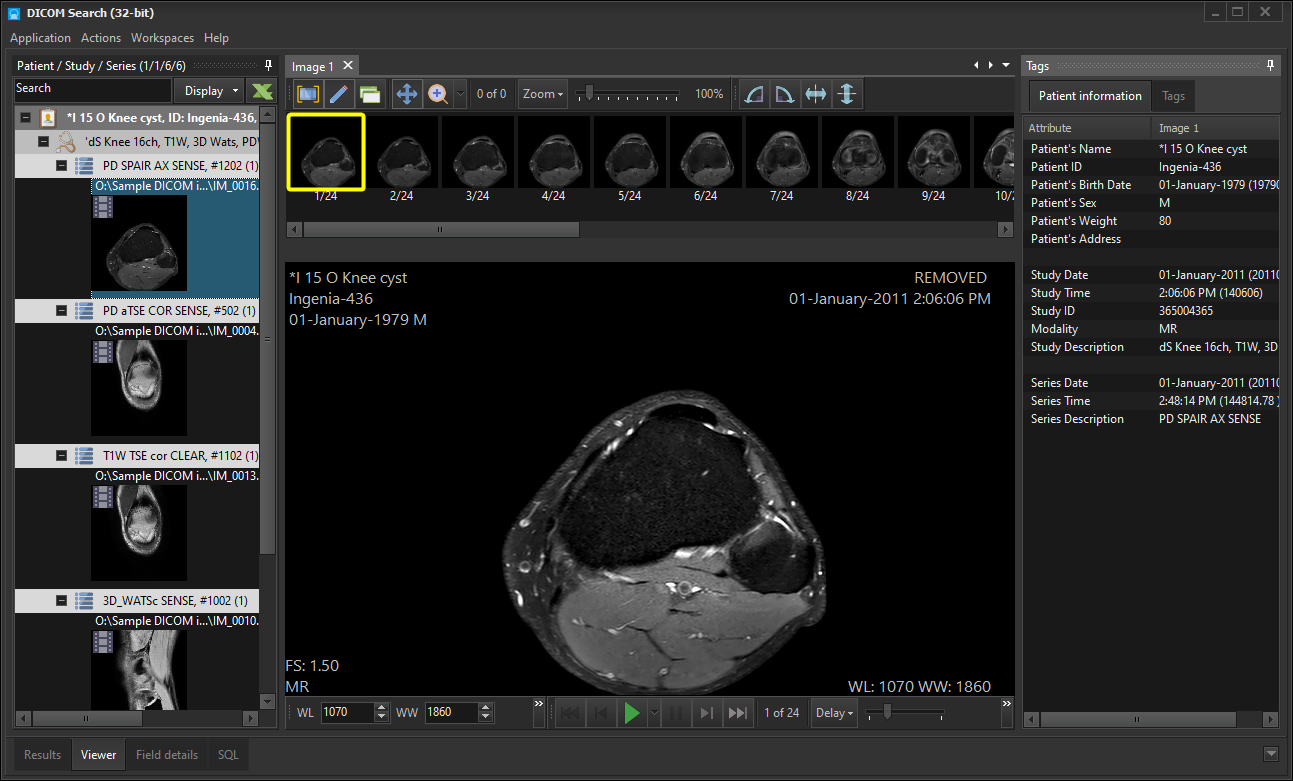
  • open the images using the internal viewer for further analysis

The above just scratches the surface on what DICOM Search can do.  Learn more about the product on our website, or watch the introductory video here.

Download a 14-day trial of DICOM Search now and start searching your DICOM images efficiently and effortlessly to make new discoveries.

Calculate NPV, XNPV, IRR, MIRR, and XIRR like a boss

So you need to calculate the NPV, IRR, or any of the above financial values for one investment.  Simple, right?  In Excel, you just use the relevant function on the data e.g.

But what if you need to calculate the numbers for hundreds of investments, by different categories?  For example, say we have a worksheet containing the cash flows for over 200 companies, with varying starting and ending periods, grouped by industry, sector, and risk level.

Are you able to calculate measures like the NPV and IRR for individual investments or groups of investments in Excel fast?

What if we said you could compute and display the NPV and IRR measures like this using Easy Excel Analysis in 60 seconds?

Watch this video to see how.

It could not be simpler.  Once you’ve set up the summaries, it’s just a matter of dragging which columns you want to group and compute the measures for.

Download a 14-day trial now, and experience working with your data in ways you never thought possible and gain new insights into your data.

If you need to work with data stored in databases instead of Excel worksheets, then give SQL Data Analysis a try.  It provides the same analysis capabilities as Easy Excel Analysis.