There are 3 types of summaries you can display in an analysis table.
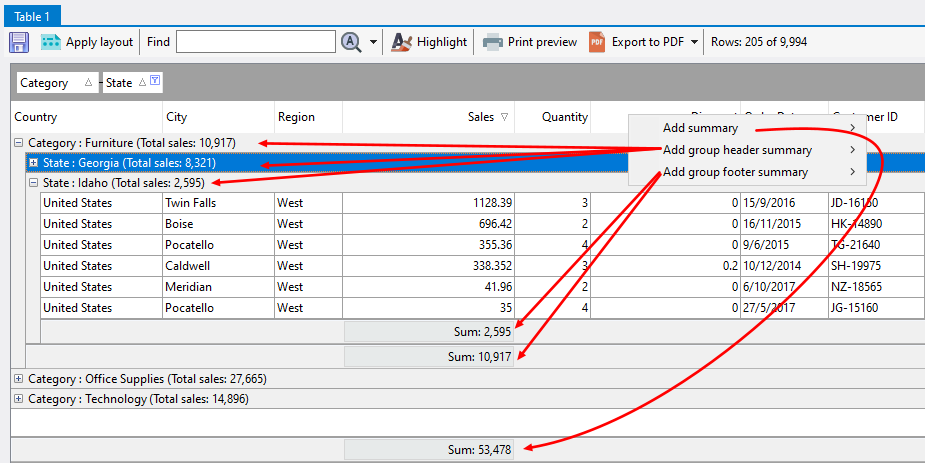
Summaries are displayed on the bottom of the table. Group header summaries are displayed on each group's header level, and group footer summaries are displayed on each group's footer level.
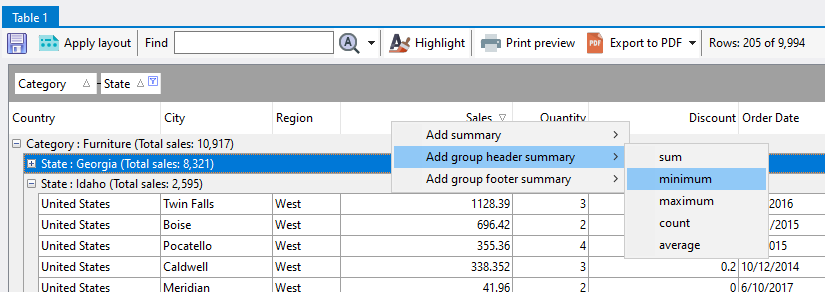
To create a summary for a column, right click on the column header to bring up the summary context menu, select the summary type you require, and the numeric operation you require.
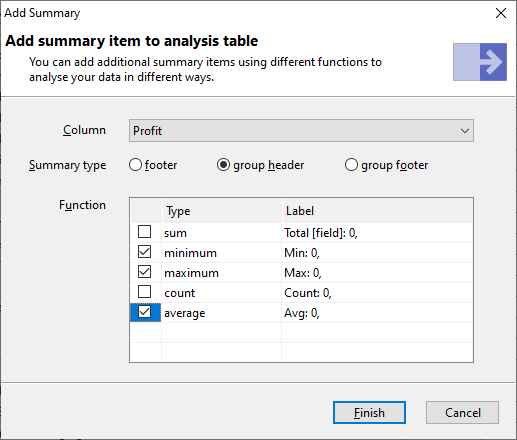
You can also create summary values by clicking on the Add button in the Summaries customization window.
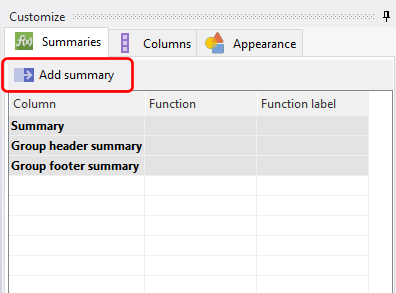
Select the column you want to create the summary for, the summary type, and the summary functions you want applied.
In the above example, we chose to create 3 group summaries. The summaries are then displayed at each grouping level.
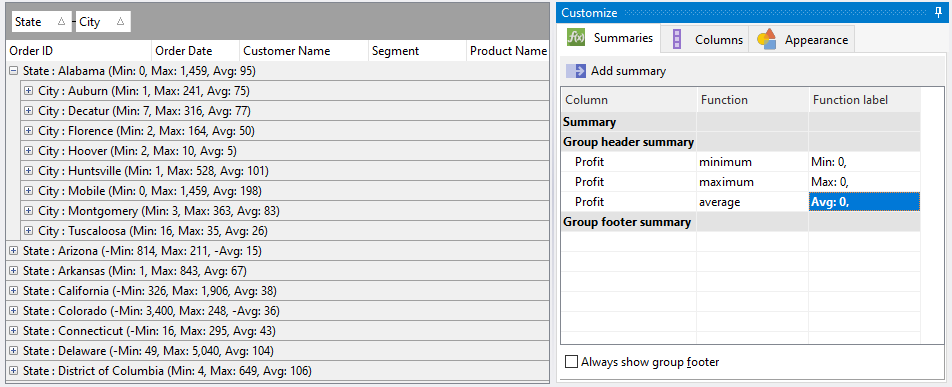
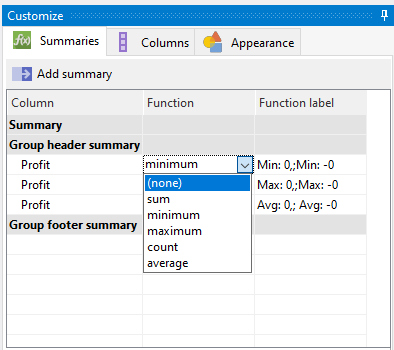
You will notice that the negative values are displayed strangely. To change how the values are displayed, change Function label values for each summary item. The first label will be used for all values. If there is a second label, it will be used for negative values. Thus, if we change our labels to the following:
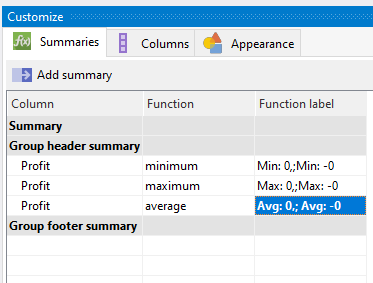
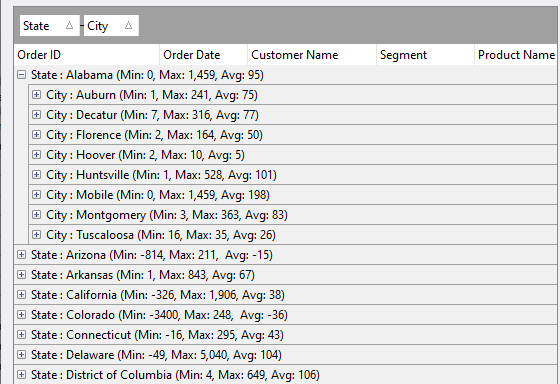
The summary values are displayed accordingly.
To remove a summary, change the function type to (none) on the summaries customization panel.