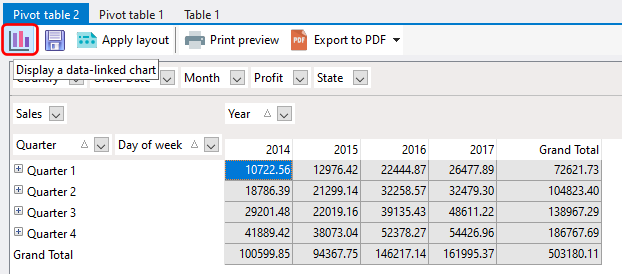
SQL Data Analysis can display and link a chart to the currently displayed data in your pivot table. To display the chart, click on the Display a data-linked chart button.
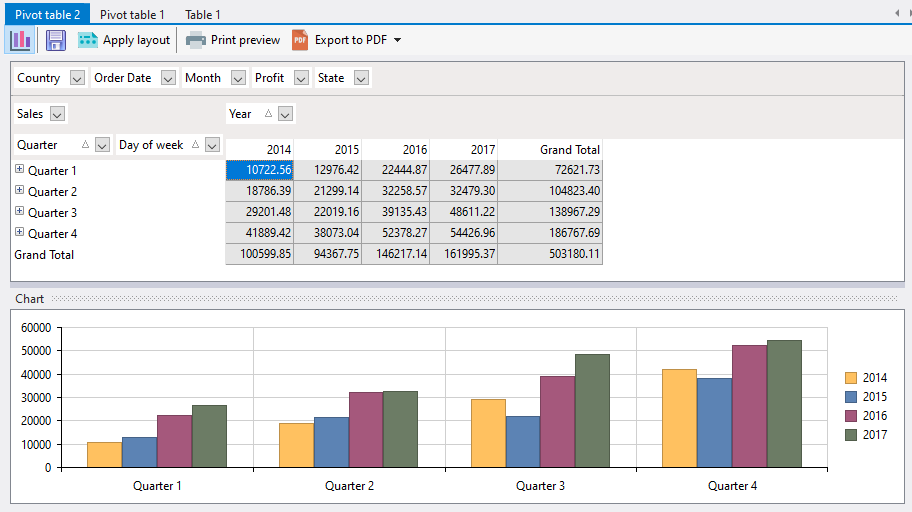
A chart visually representing the currently displayed data is then displayed on the bottom panel.
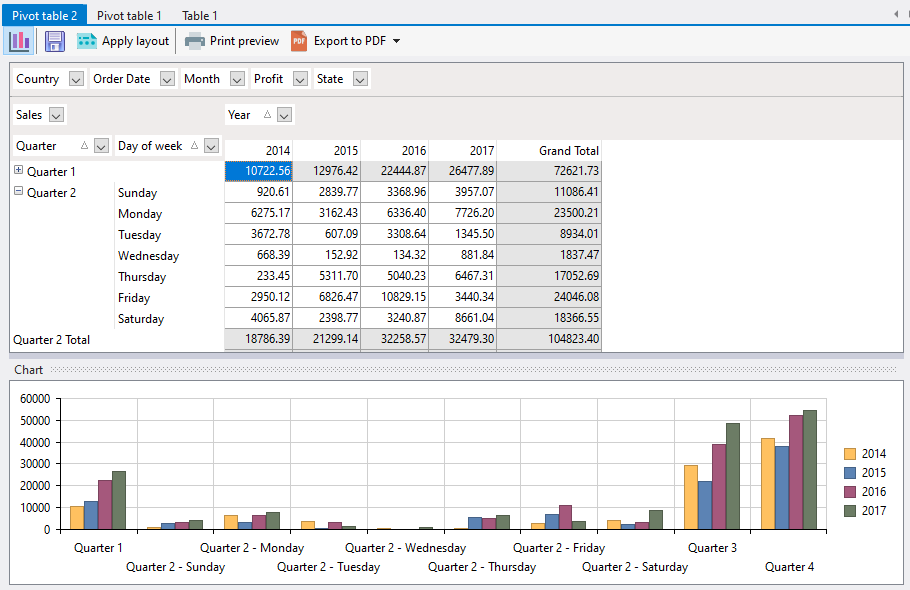
This chart responds to how the data is displayed in the pivot table. For example, if we expand Quarter 2 in the pivot table to display the Day of week values, the chart will also display the sales at that level.
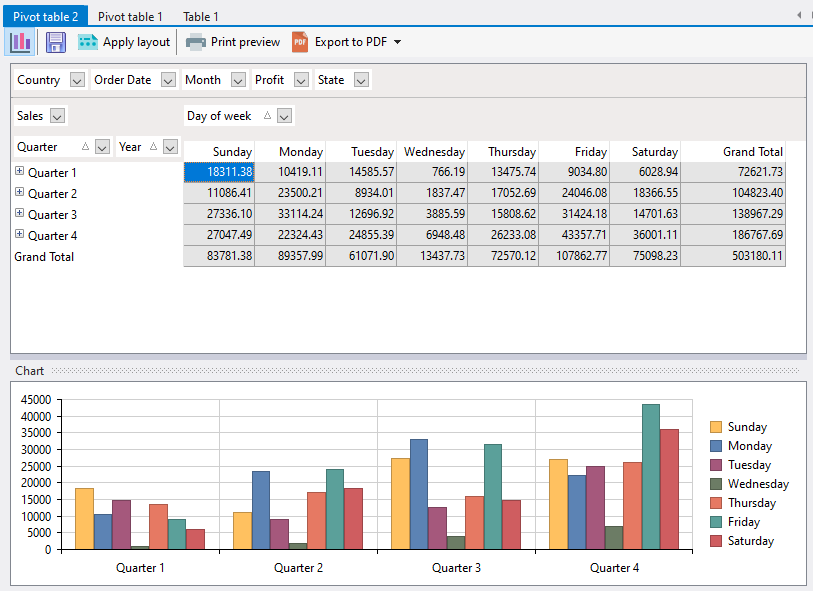
If we rearrange the columns in the row and column fields area, the chart is updated accordingly. For example, if we switch the positions of the Year and Day of week columns, the chart is updated accordingly.