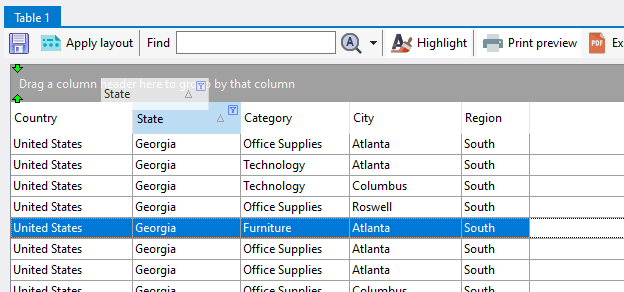
To group your data, drag and drop the column header to the grouping panel at the top of the table. In the example below, we are dragging the State column to the grouping panel.
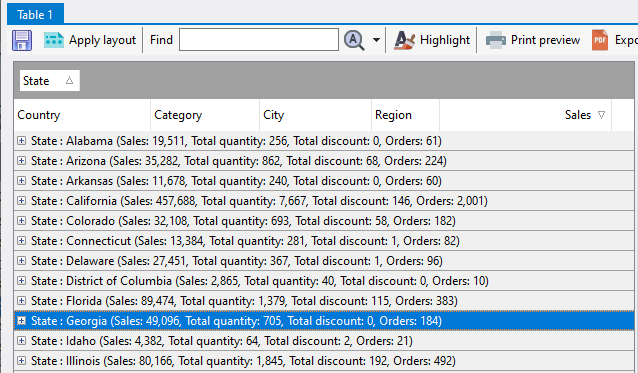
The table data is then automatically grouped by the State values.
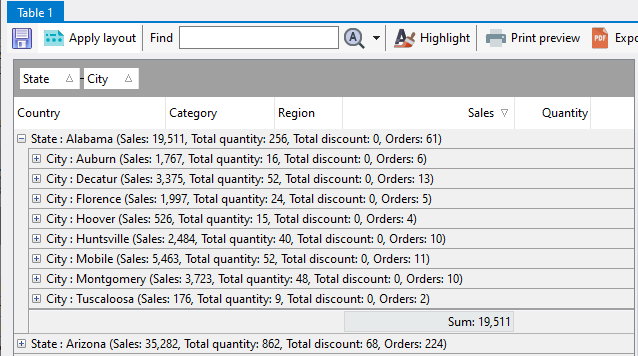
You can create multiple grouping levels simply by placing multiple columns in the grouping area.
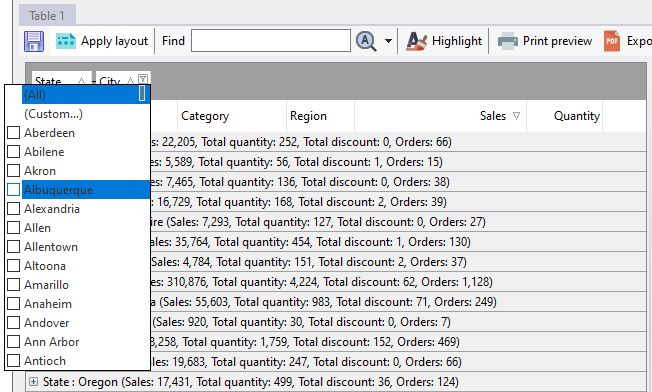
You can still sort and filter on the the grouped columns by clicking on the column header or on the filter icon in the column header.