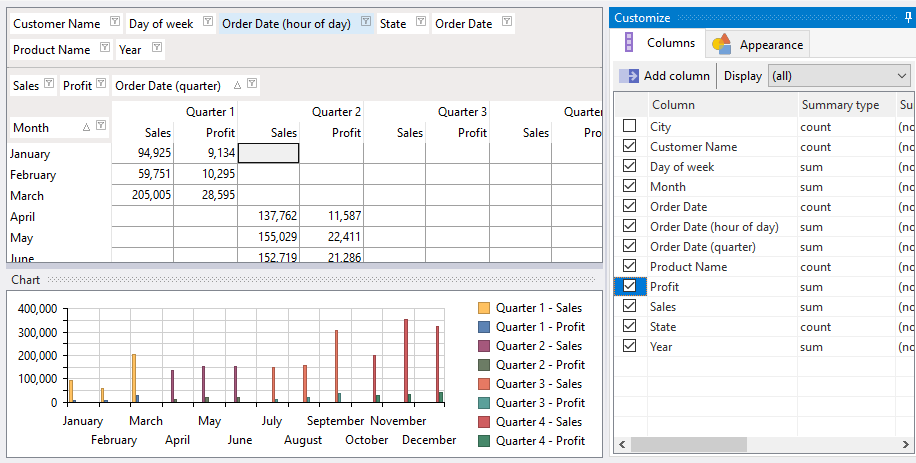
The displayed chart is linked to the pivot table. To hide a chart series, either drag the column away from the data fields area, or hide the column. In the example below, we have 2 data groups/series: Sales and Profit.
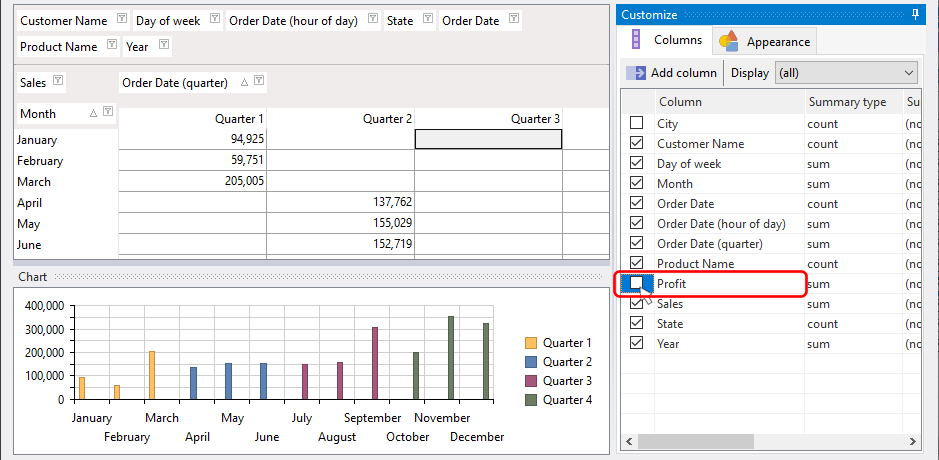
If we don't want to display the Profit series on the chart, one way to achieve that is to hide the column. Simply uncheck the Profit column from the Columns customization window.