|
Click on the Use measure mode button to select the view mode, or press the E key when the image is in focus.

There are 7 sub-modes in the measurement mode. Press the E key when in this mode to switch between the sub-modes.
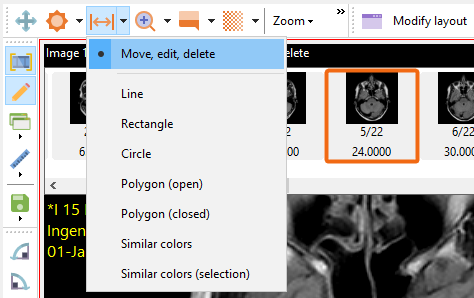
Each of the sub-modes allow you to measure points on the image using various shapes.
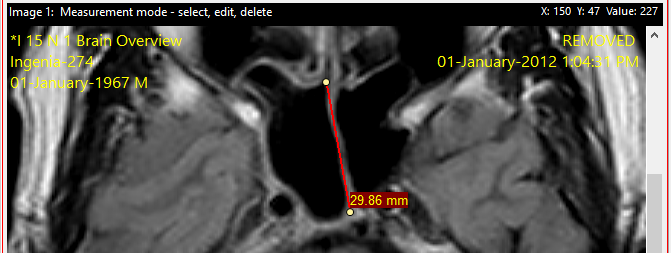
Line tool
The line tool lets you draw a line on the image by first clicking on the first point, then on the second point. You can also draw a line by clicking and holding down the mouse button on the first point, then dragging the mouse to the second point, and release the mouse button.
The line length is displayed once the line has been drawn.
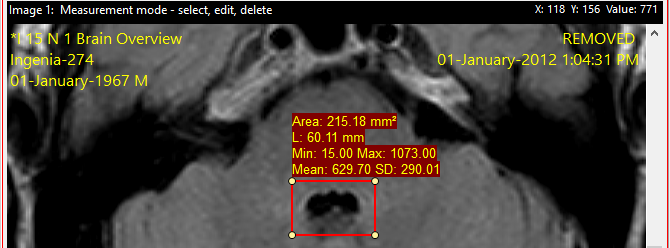
Rectangle tool
The rectangle tool lets you draw a rectangle on the image by clicking and holding down the mouse button on the first point, then dragging the mouse to the second point, and release the mouse button.
The area and perimeter of the rectangle is then displayed. The minimum and maximum Hounsfield units in the rectangle are also displayed, together with the mean and standard deviation values.
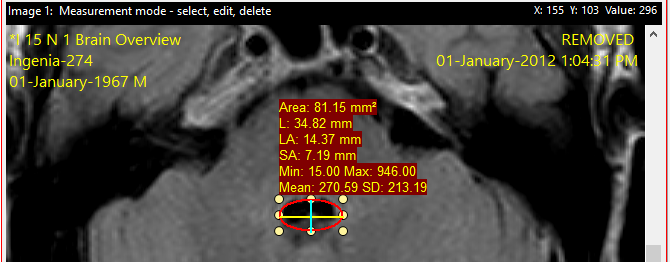
Circle tool
The circle tool lets you draw a ellipse/circle on the image. Click on an area in the drag and while holding down the mouse button, drag the mouse to draw an ellipse. Hold down the ALT button while dragging the mouse to draw a circle.
The area and perimeter of the ellipse/circle is then displayed. The minimum and maximum Hounsfield units (HU) in the rectangle are also displayed, together with the mean and standard deviation values. In addition, the length of the longest axis is displayed, together with the length of the longest line that is perpendicular to the longest axis. The former is displayed using the LA abbreviation, and the latter the SA abbreviation.
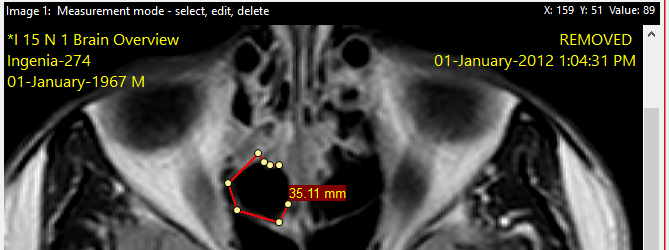
Polygon (open)
The open polygon tool lets you draw a series of lines on the image by creating a series of points on the image by clicking on the mouse button. To end the polygon, double click on the last point.
The polygon length is displayed once the last point has been created.
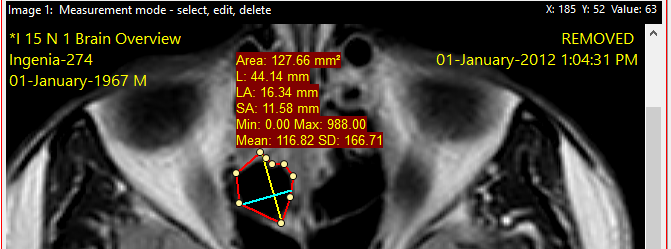
Polygon (closed)
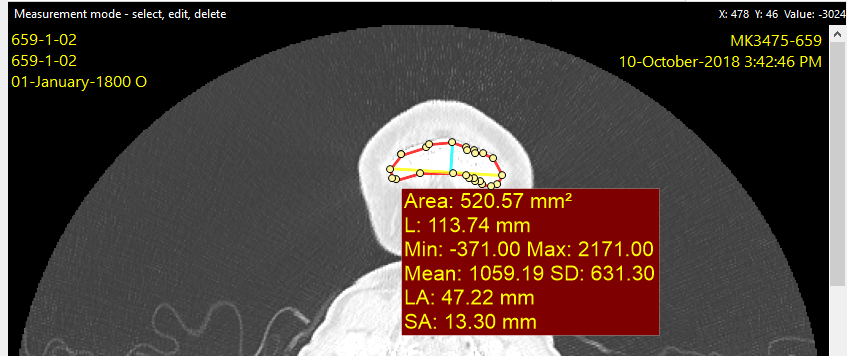
The closed polygon tool lets you draw a shape on the image by creating a series of points on the image by clicking on the mouse button. To close the polygon, double click when you create the last point. The polygon is then automatically closed.
The area and perimeter of the polygon is then displayed. The minimum and maximum Hounsfield units (HU) in the rectangle are also displayed, together with the mean and standard deviation values. In addition, the length of the longest axis is displayed, together with the length of the longest line that is perpendicular to the longest axis. The former is displayed using the LA abbreviation, and the latter the SA abbreviation.
Similar colors
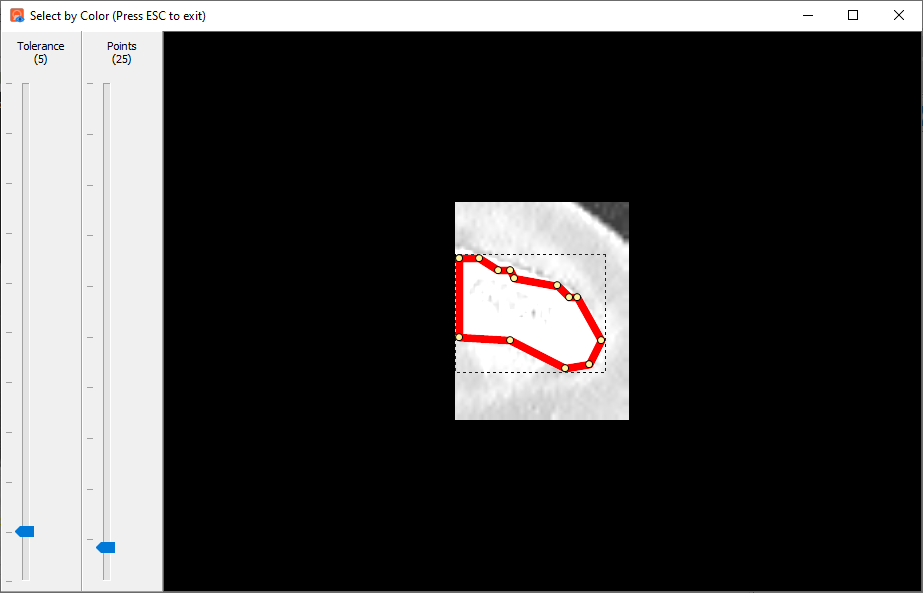
The similar colors tool lets you draw a shape on the image by selecting areas of a similar color. When you select this tool, a new window is displayed where you first click on a point in the area you want to select.
You can then enlarge or reduce this selection by adjusting the color tolerance level of the selected point. Increasing the tolerance level will include more dissimilar colors.
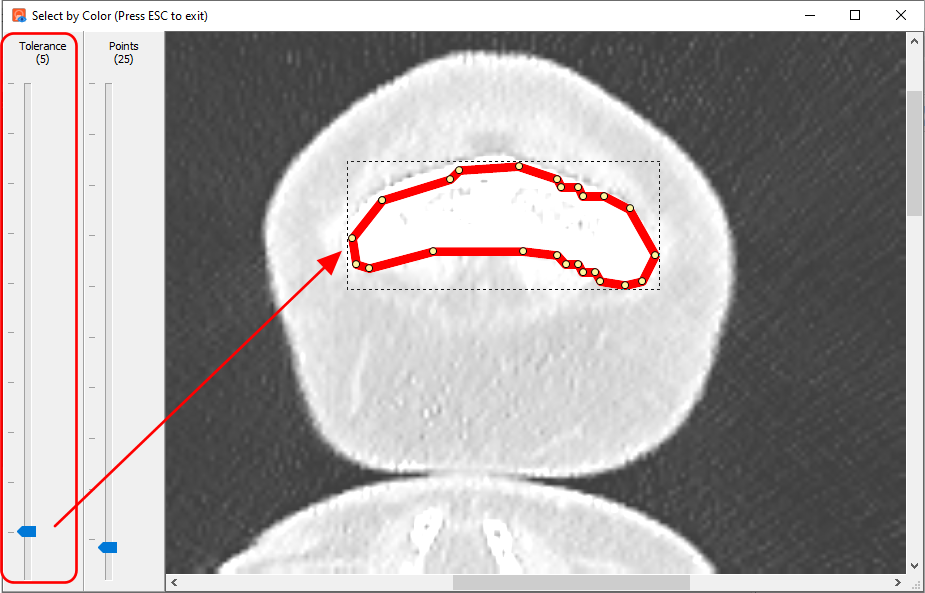
You can also adjust the number of points to increase or decrease the number of points used to form the shape.
Press the escape key to end the selection and your new polygon is then created. The area and perimeter of the polygon is then displayed. The minimum and maximum Hounsfield units (HU) in the rectangle are also displayed, together with the mean and standard deviation values. In addition, the length of the longest axis is displayed, together with the length of the longest line that is perpendicular to the longest axis. The former is displayed using the LA abbreviation, and the latter the SA abbreviation.
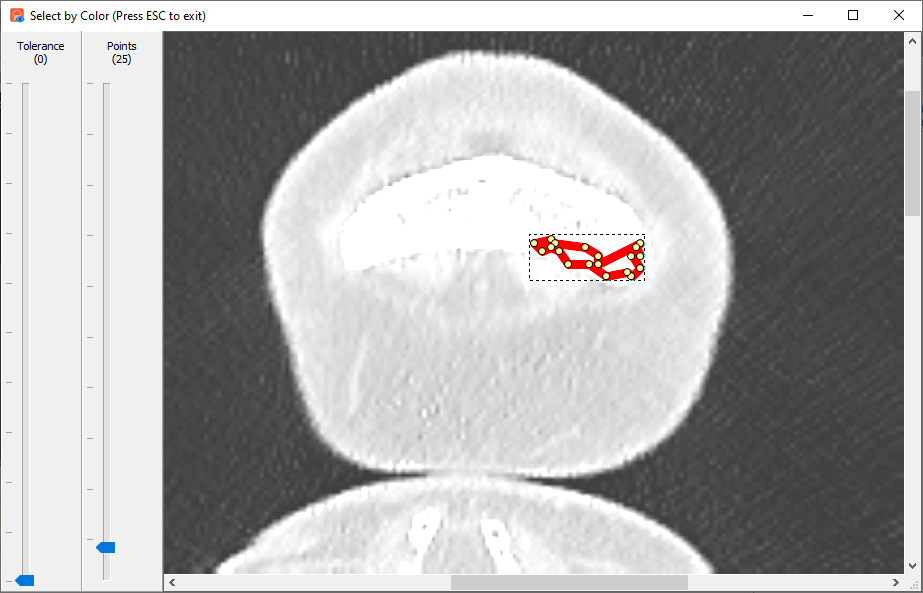
Similar colors (selection)
When you need to constrain the selection to a specific area using the similar colors tool (described above), use this tool instead. Once you've selected this tool, click and drag on a region in the image.
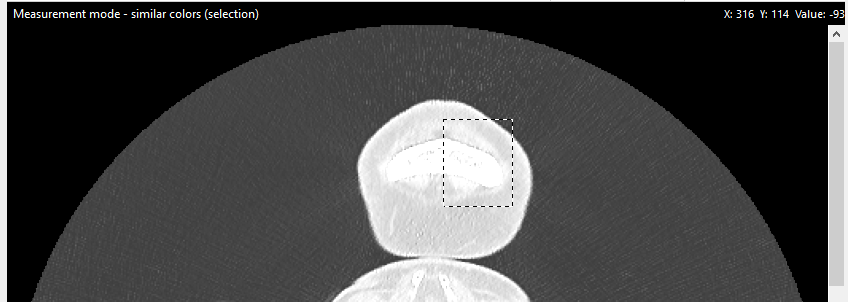
This selected region is then displayed in the Select by Color window, where you can then create the polygon shape using the same steps described for the Similar colors tool. The difference now is that the shape is constrained to the selected region.
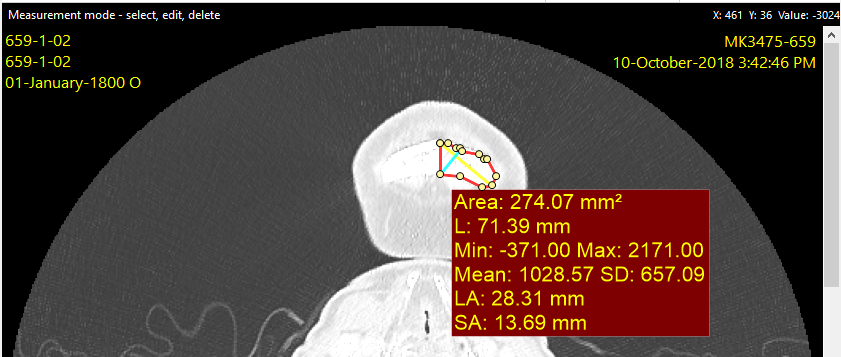
Like before, click on the escape key to confirm the selection. The polygon is then created and the values displayed accordingly.
|