By default, all columns in the pivot table are not grouped. For example, the profit column, when used as a row column, will simply display a single line for each record.
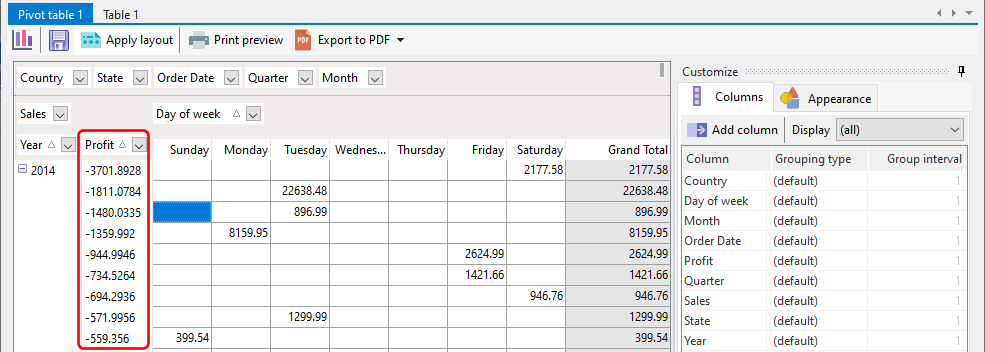
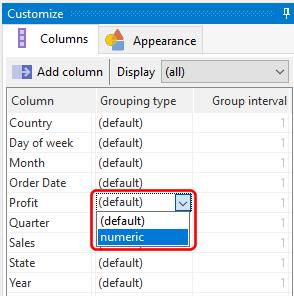
This isn't particularly useful. Instead, we can first grouping the column using its values by selecting the numeric grouping type.
The pivot table now displays the profit values in increments of 1.
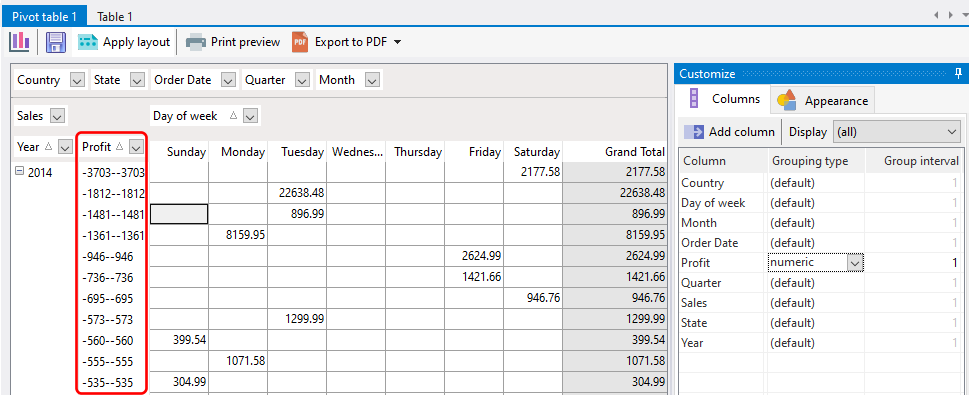
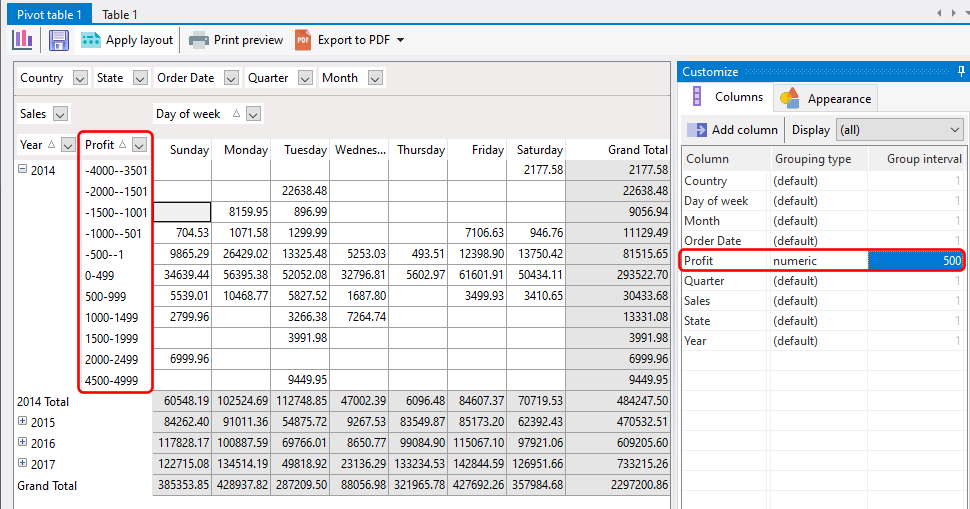
This is still a lot of rows, and not summarized enough. Let's change the group interval to increments of 500.
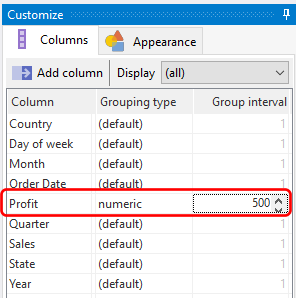
Now, the profit (or loss) values are summarized in increments that aren't overwhelming to analyze.
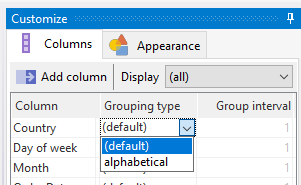
The available grouping types depend on the column data type. For textual data, you can group data alphabetically.
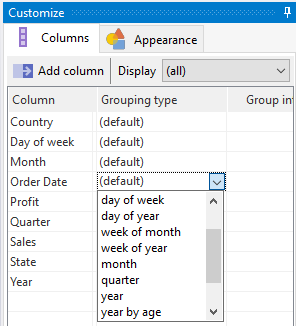
For dates, you have more grouping options.
Using the appropriate grouping type and grouping interval allows you to analyze your data in many more ways.