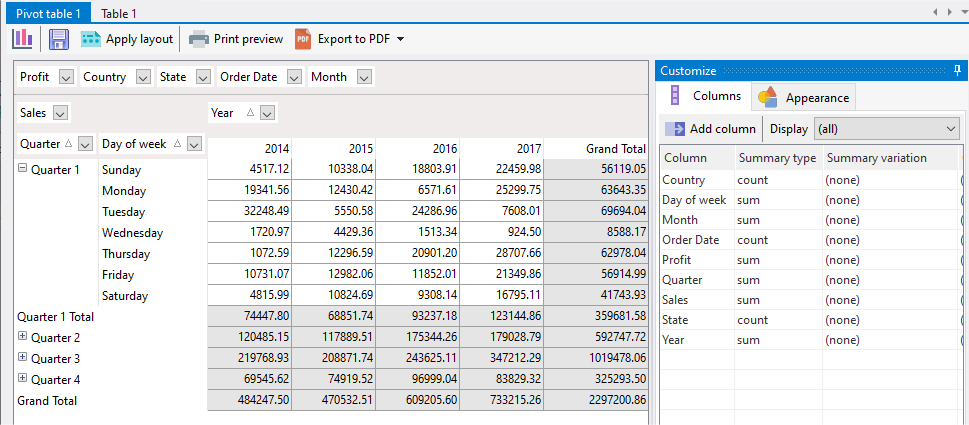
By default, all summaries are displayed as a sum of the data field.
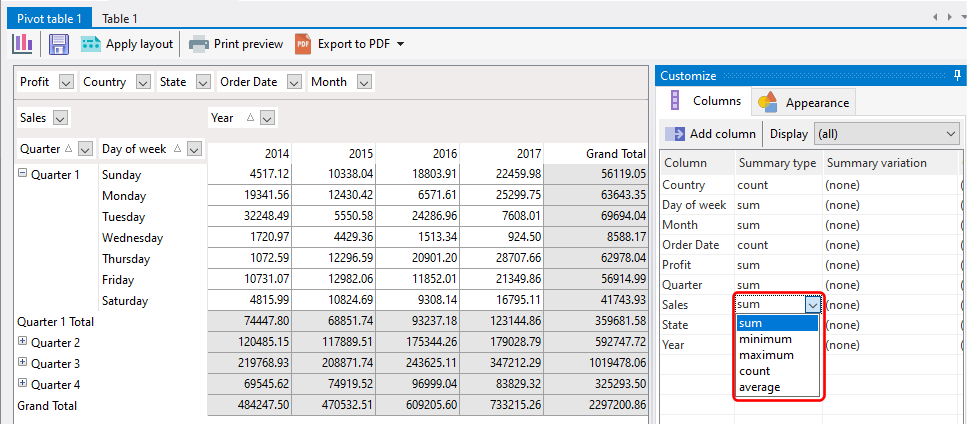
You can change the summary type by clicking on the summary type item on the Columns panel on the right.
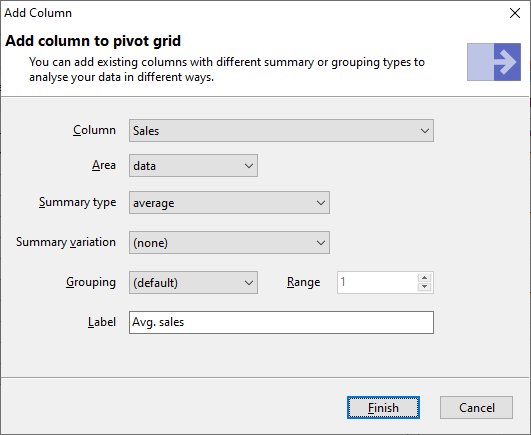
You can also add columns to display a different summary type. Let's say we want to add a column to display average sales. Click on the Add column button on the Columns panel.
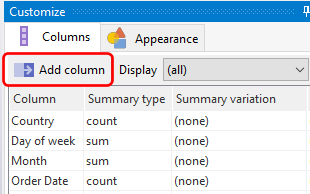
Select the data you want to display for this new column. In this example, we select the average summary type, and create a new label for this new column.
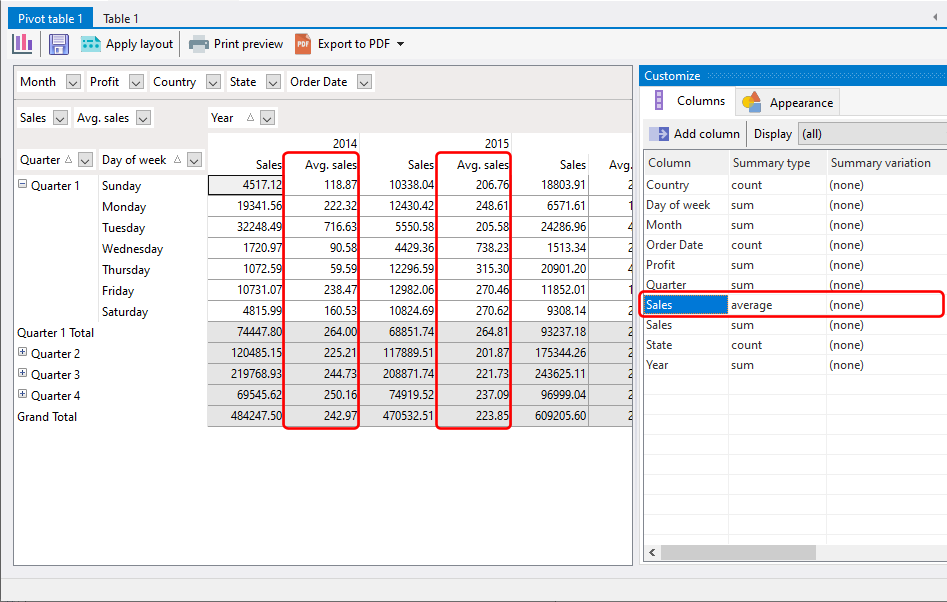
Once completed, the new column is created and displayed.
Summary variations
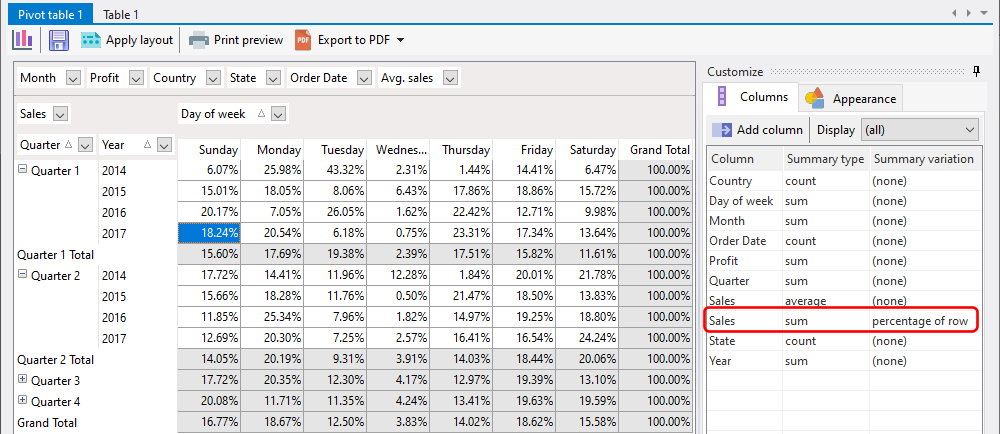
Summary variations change how the data is displayed. Instead of just displaying the summarized value, each value is compared to another value. You can select a summary variation by clicking on a column's summary variation item:
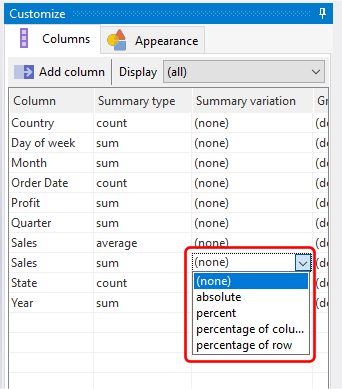
In the example below, the sales amount is now displayed as a percentage of the row, to allow us to view the trend of sales for each day of the week for each quarter and year combinations.