The pivot table consists of 4 areas, and the placement of fields in these areas determine how your data is displayed.
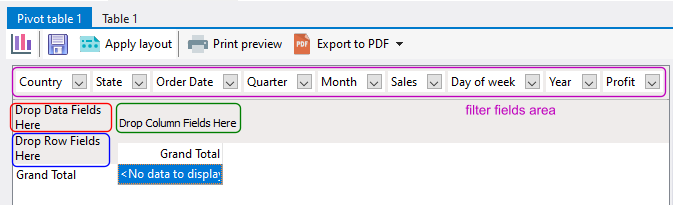
In the above example, no data, column, or row fields have been defined. We will now set up our data for display. To position any of the columns in the areas, click on the column header and drag the column header to the area you want to position the column. You can place as many columns are you require in the data fields, row fields, and column fields areas. The order of the columns in those area affects how the data is displayed in the master-detail levels.
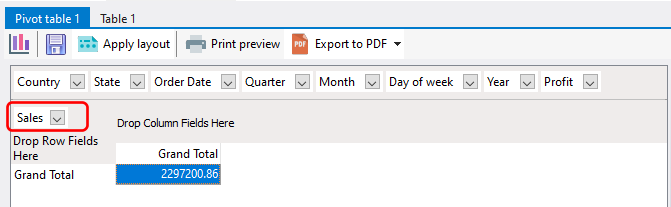
Data fields area
Data fields are columns that contain data you want to summarize. These are usually numeric columns. In our example, we want to summarize our sales amount, so we will position the Sales column from the filter fields area at the top to the data fields area.
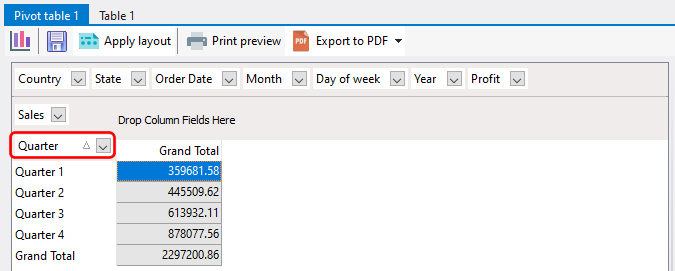
Row fields area
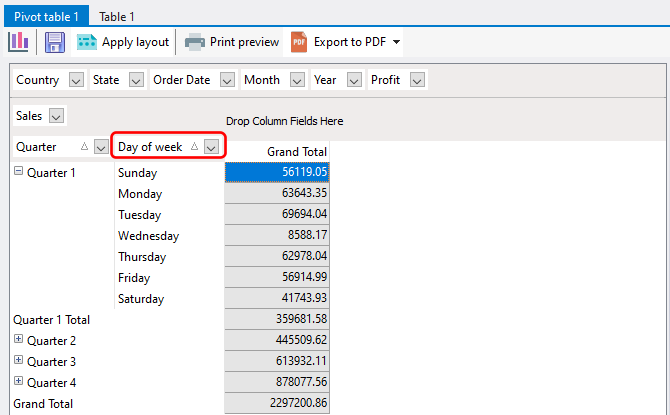
Row fields are columns you want to analyze the data columns on, arranged vertically. In our example, he total sales amount is now displayed but there are no details for this amount. Say we want to view the total sales for each quarter. We will position the Quarters column in the row fields area.
Now we can see the sales for each quarter. Let's say we want to drill down further, to view the sales for each day of the week. To do that, we simply position the Day of week column next to the Quarter column in the row fields area.
Column fields area
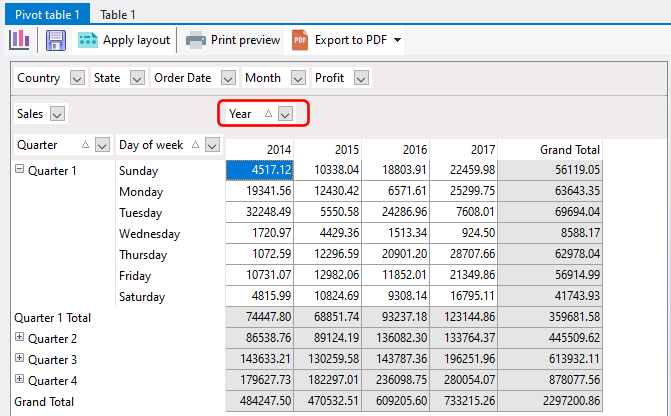
Column fields are columns you want to analyze the data columns on, arranged horizontally. In our example, we can now view the sales for each quarter and day of the week. However, our data set contains data from 2014 to 2017. Let's analyze the yearly trend by positioning the Year column on the column fields area.
Data fields area
Columns that are not used in the data, column, or rows area are placed in the data fields area. This reduces the volume of data that's displayed in the pivot table. Columns in the filter fields area can still be used - you can filter their values so only data meeting the filter criteria are summarized and displayed in the pivot table.
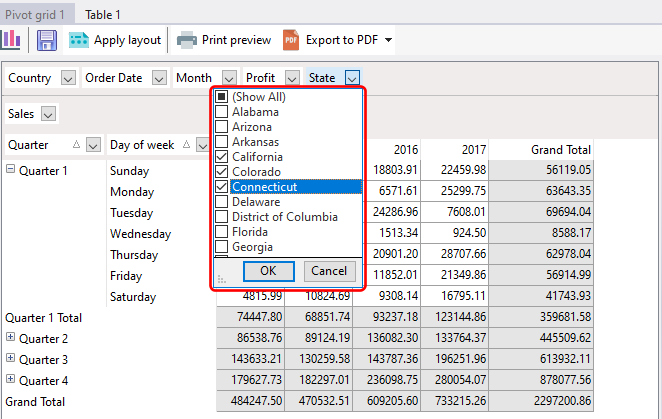
In our example, we can apply a filter on the State column to display on sales from California, Colorado, and Connecticut.