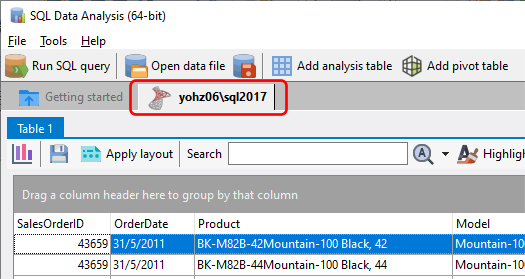
Once you have a data set to analyze, SQL Data Analysis creates a tab for that data set. For example, if we just added a SQL Server data set, the following tab is created:
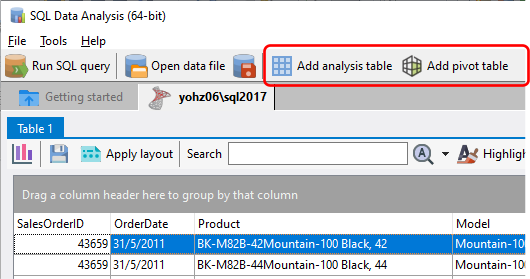
You can create additional analysis tables or pivot tables using data from the same file by clicking on the Add analysis table or Add pivot table buttons.
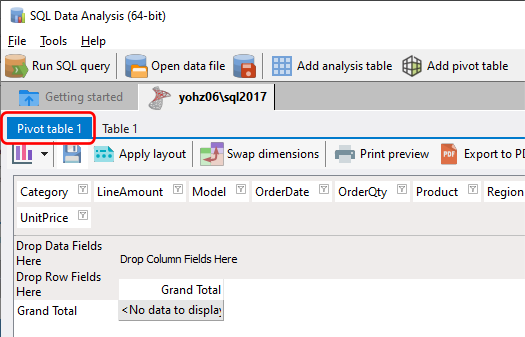
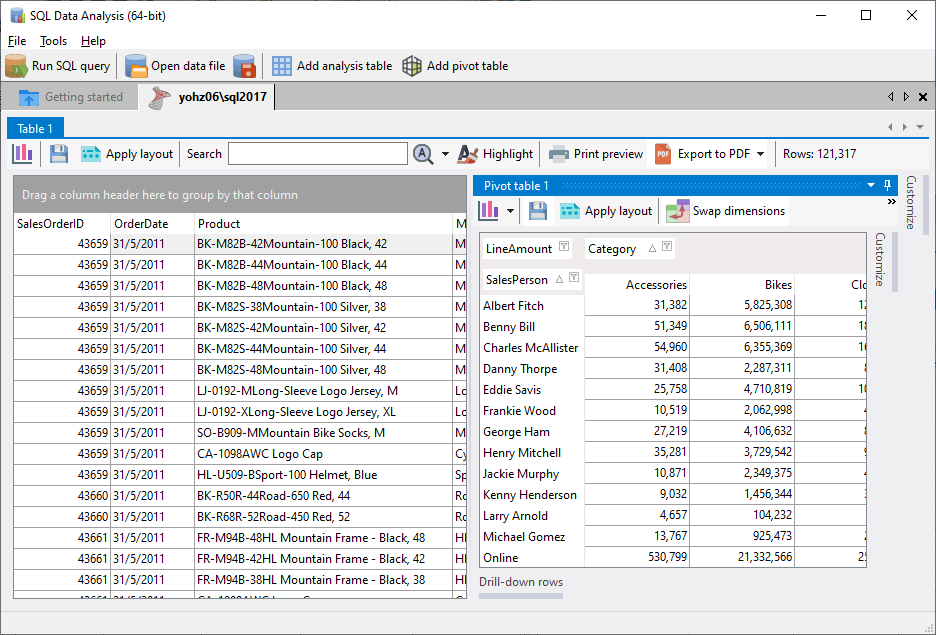
If you now add a pivot table, it will be created in a tab named Pivot table x.
You can re-arrange the position of each analysis and pivot table simply by clicking on the item's tab and dragging it to the desired location. For example, you can arrange the pivot table to be displayed next to the analysis table this way.
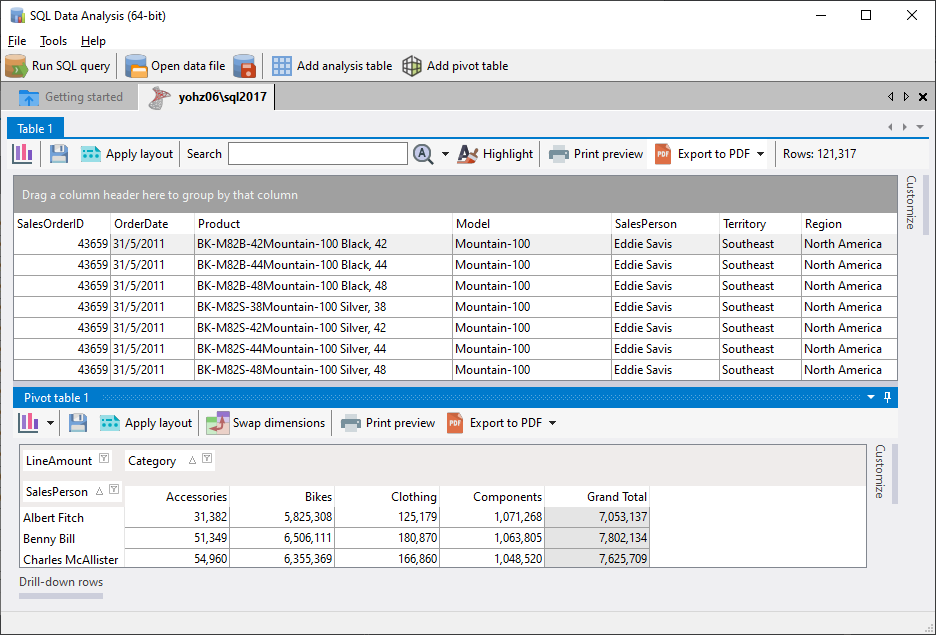
or you could have it placed on the bottom e.g.