The Results window has 3 distinct areas:
•The Scripts area
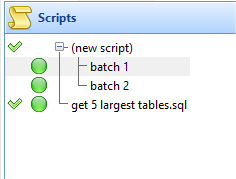
The status of the scripts that were ran in the project are listed here. The icons in the first 2 columns tell us the outcome of the scripts. In the first column, a green check mark indicates that the script was found, while a red cross indicates that the script file was missing.
In the second column, a green circle indicates that the script was ran successfully on all the servers. A yellow circle indicates that there were come errors running the script on some servers, while a red circle indicates that the script failed to run on any of the servers.
Selecting a script or script batch will update the Dataset area to display the results of the selected script/batch.
•The Servers area
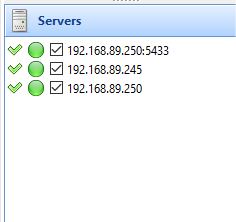
A list of servers that were used in the project are listed here. The icons in the first 2 columns tell us the outcome of the server connections. In the first column, a green check mark indicates that the server could be connected to successfully. A red cross indicates that SQL Multi Select failed to connect to the server.
In the second column, a green circle indicates that all scripts ran successfully on the server. A yellow circle indicates that some scripts failed on the server, while a red circle indicates that all scripts failed.
Selecting a server will update the Dataset area to display the dataset containing results (if any) from the selected server.
Deselecting a server will hide the results from that server in the Dataset area.
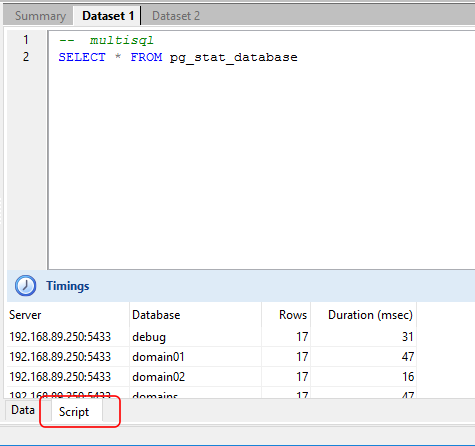
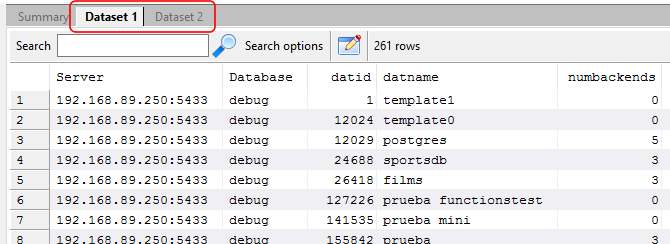
•The Dataset area
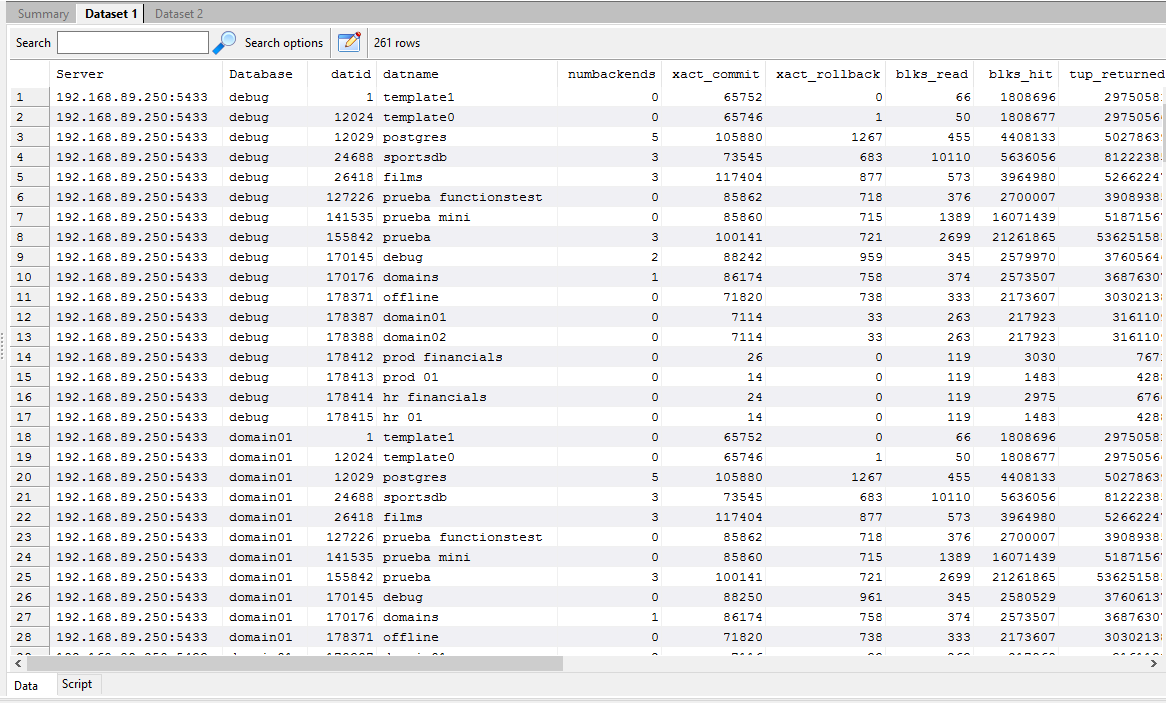
This area displays the data returned from the scripts. The server and database from which the results were returned from are indicated in the first 2 columns.
If a script returns different datasets from different servers, additional datasets will be displayed. For e.g. on PostgreSQL, the pg_stat_database table contains different values depending on the version of PostgreSQL that is running. Thus, if a script queries that table from a PostgreSQL 8.3 and a PostgreSQL 9.6 database, SQL Multi Select displays 2 datasets.
For each dataset, you can also view details of the script execution on each server by selecting the Script tab. The script/batch that was run is displayed, and in the Timings section, the number of rows returned and the time it took the script/batch to complete are displayed.