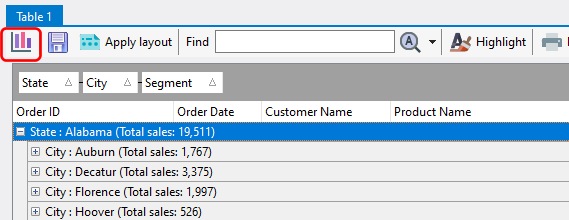
SQL Data Analysis can display and link a chart to the currently displayed data in your analysis table. To display the chart, click on the Display a data-linked chart button.
A chart visually representing the currently displayed data is then displayed on the bottom panel.
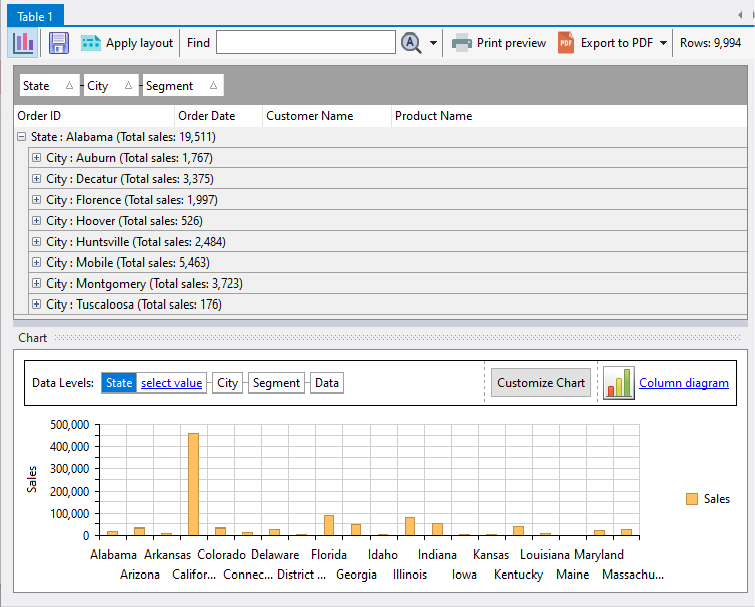
To display values in the chart, you need to first create a grouping of one or more columns in your analysis table, and create one or more group header summaries. Each group will create a data group in the chart, and each group header summary will create a data series.