A pivot table displays summarized data in a tabular form, allowing you to group the data across many dimensions.
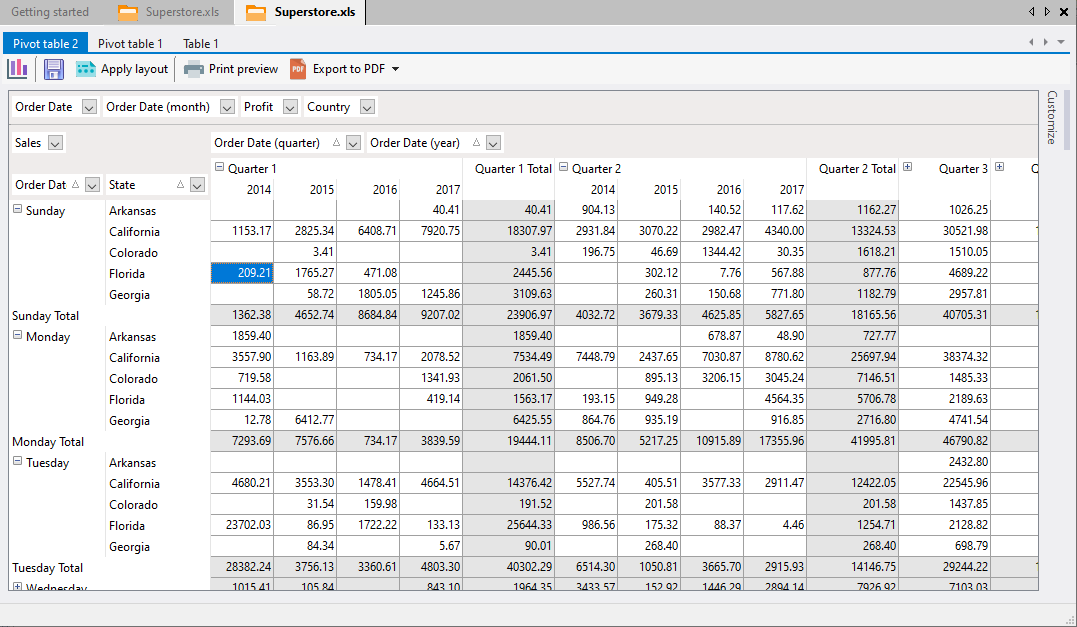
Once the pivot table is created, you can perform the following actions:
•display one or more summaries from a single column
•create custom groups to analyze your data
•filter your data to display only specific items
•sort on one or more columns
•analyze your data visually using charts
•print and export your pivot table