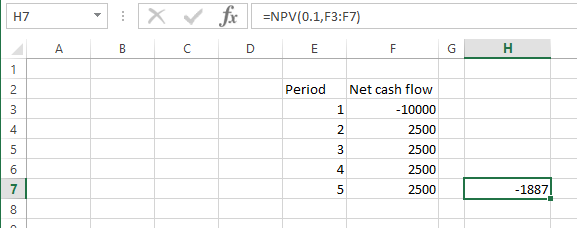
So you need to calculate the NPV, IRR, or any of the above financial values for one investment. Simple, right? In Excel, you just use the relevant function on the data e.g.

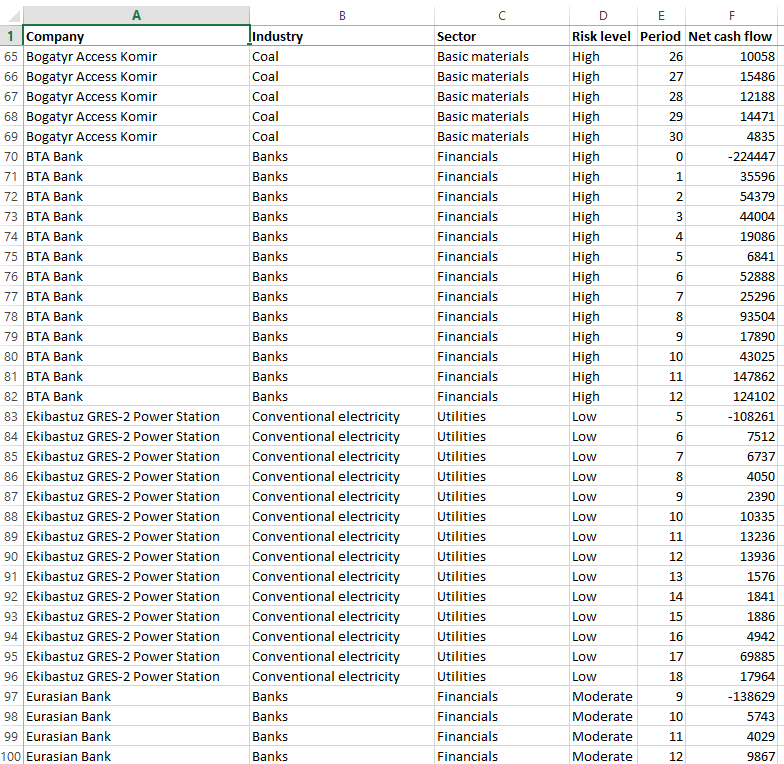
But what if you need to calculate the numbers for hundreds of investments, by different categories? For example, say we have a worksheet containing the cash flows for over 200 companies, with varying starting and ending periods, grouped by industry, sector, and risk level.

Are you able to calculate measures like the NPV and IRR for individual investments or groups of investments in Excel fast?
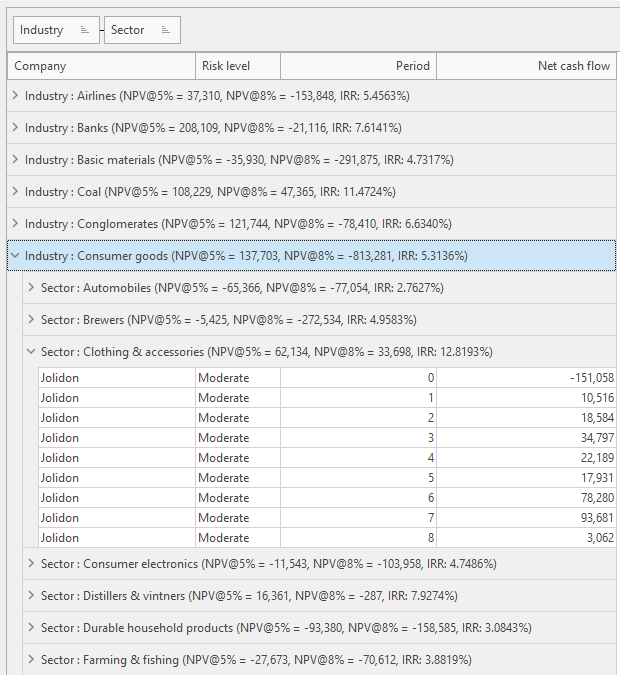
What if we said you could compute and display the NPV and IRR measures like this using Easy Excel Analysis in 60 seconds?

Watch this video to see how.
It could not be simpler. Once you’ve set up the summaries, it’s just a matter of dragging which columns you want to group and compute the measures for.
Download a 14-day trial now, and experience working with your data in ways you never thought possible and gain new insights into your data.
If you need to work with data stored in databases instead of Excel worksheets, then give SQL Data Analysis a try. It provides the same analysis capabilities as Easy Excel Analysis.