Category Archives: SQL Data Analysis

Calculate NPV, XNPV, IRR, MIRR, and XIRR like a boss

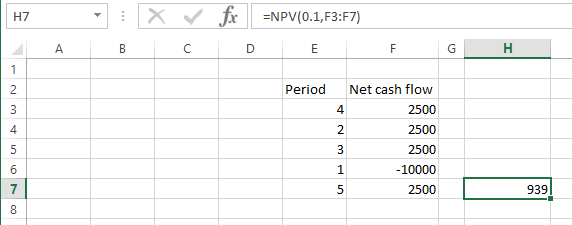
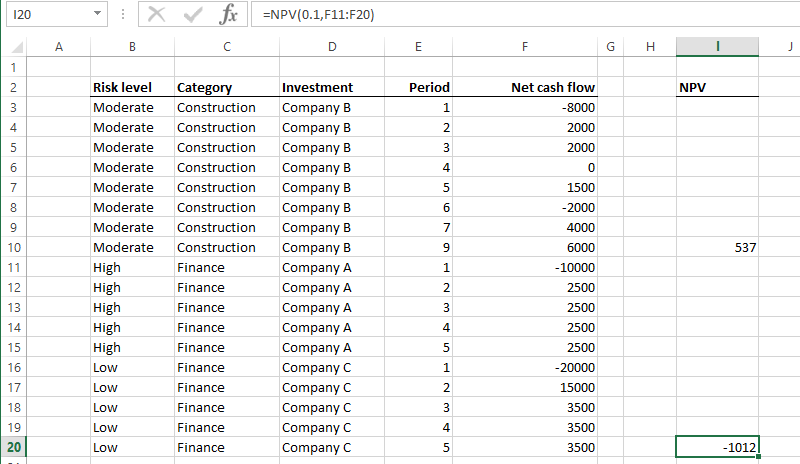
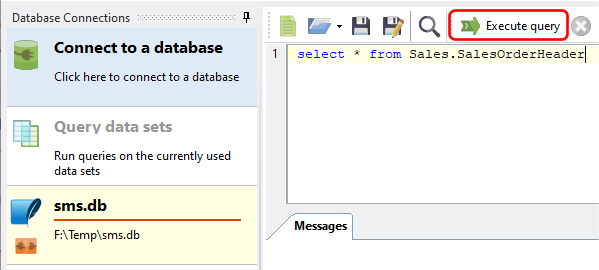
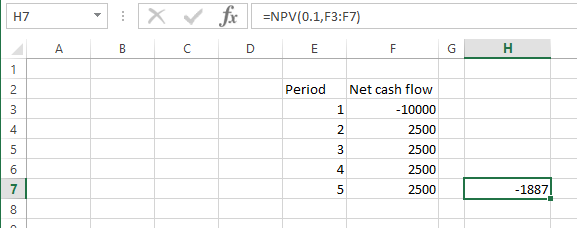
So you need to calculate the NPV, IRR, or any of the above financial values for one investment.  Simple, right?  In Excel, you just use the relevant function on the data e.g.

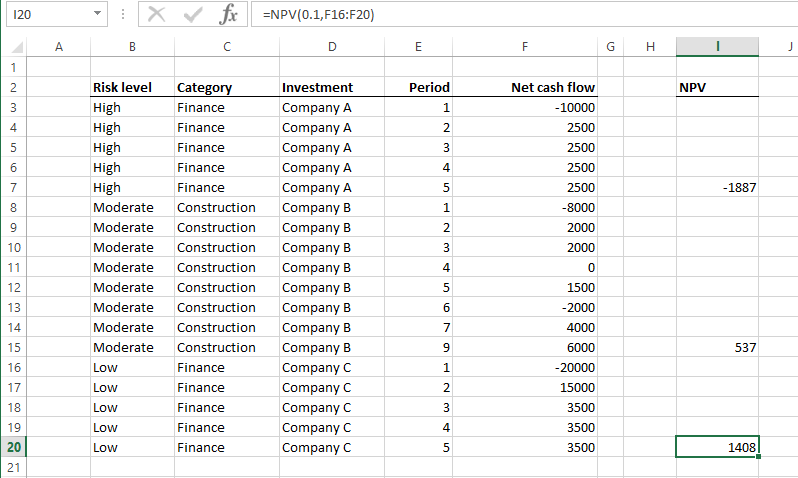
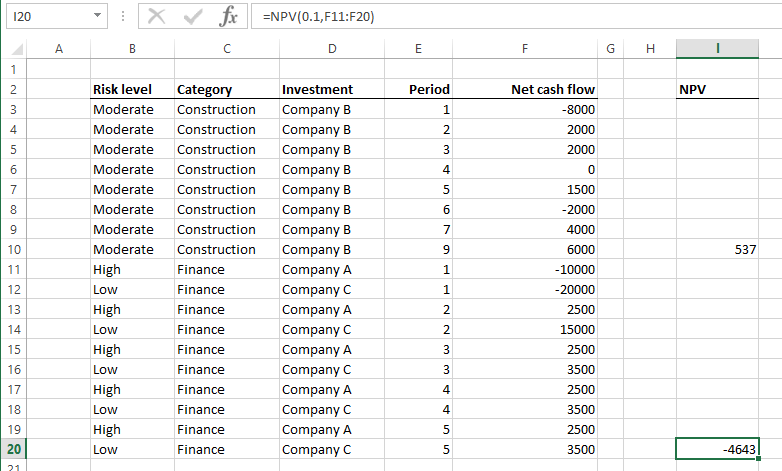
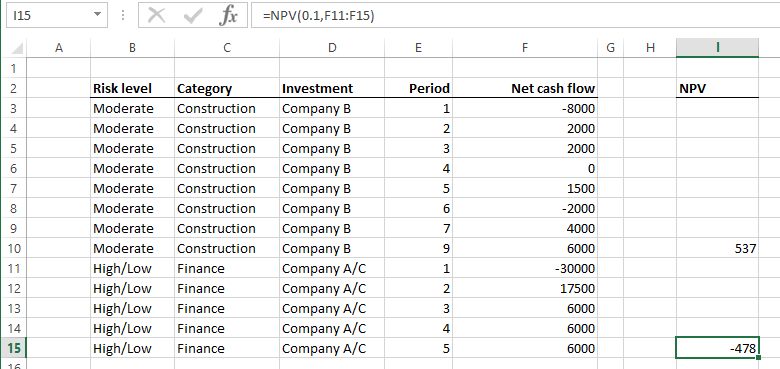
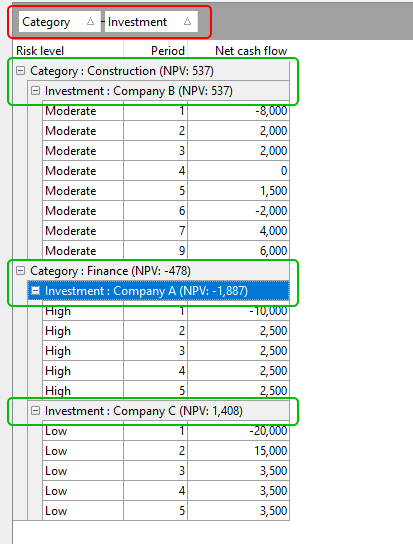
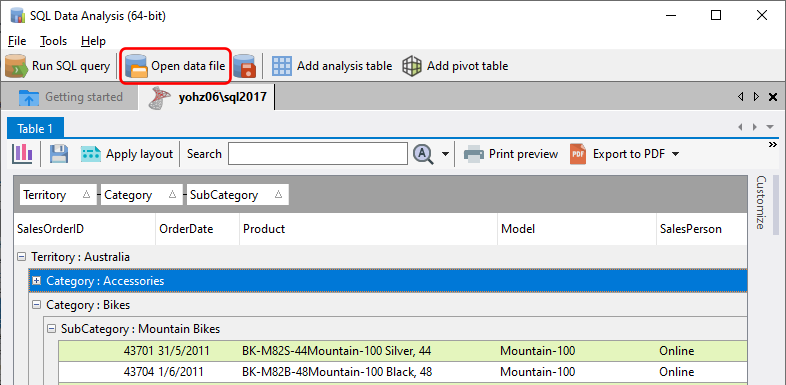
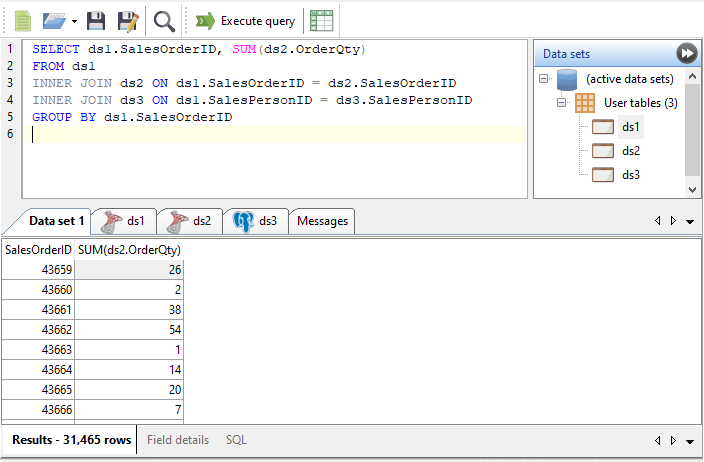
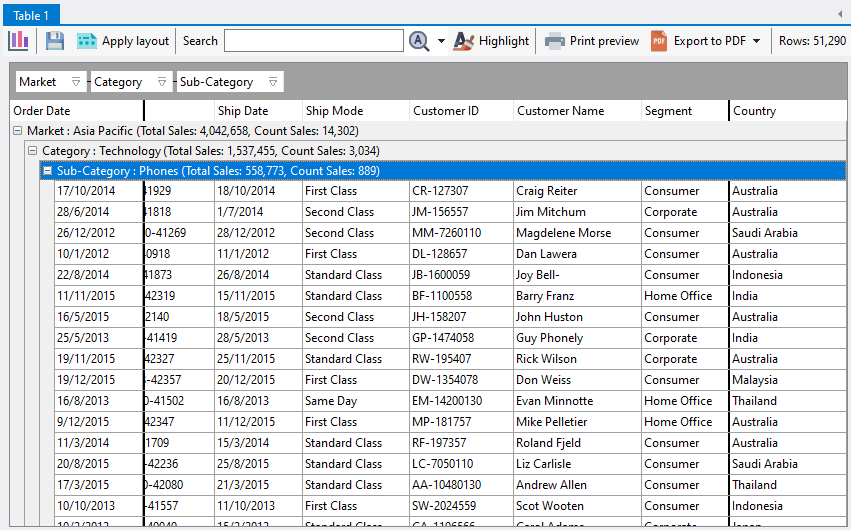
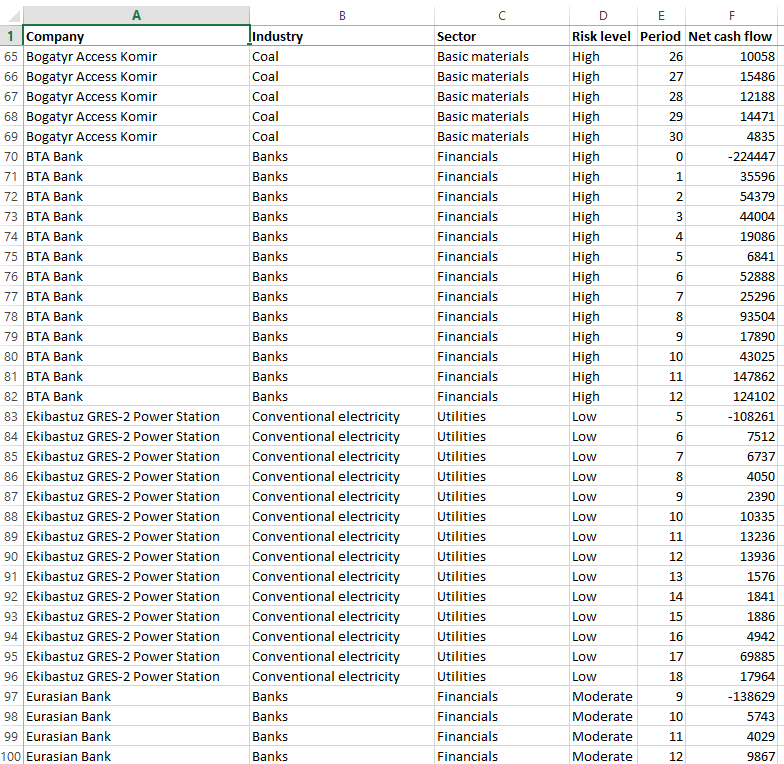
But what if you need to calculate the numbers for hundreds of investments, by different categories?  For example, say we have a worksheet containing the cash flows for over 200 companies, with varying starting and ending periods, grouped by industry, sector, and risk level.

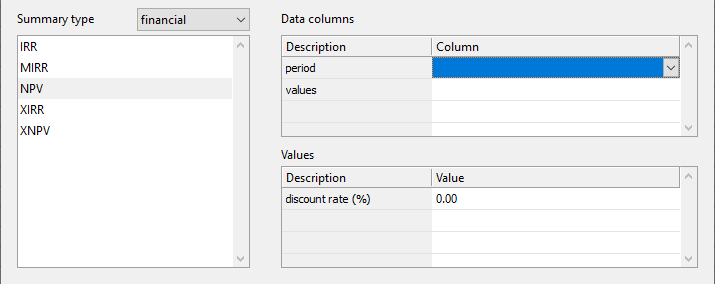
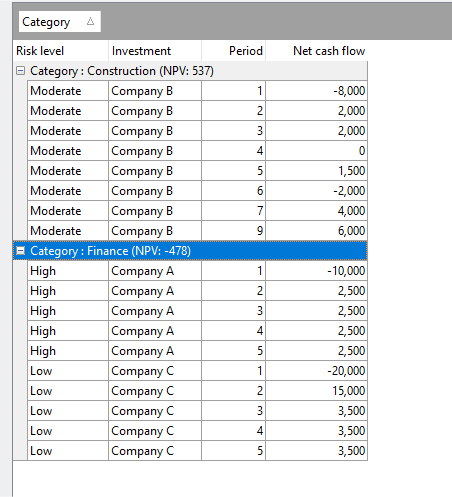
Are you able to calculate measures like the NPV and IRR for individual investments or groups of investments in Excel fast?

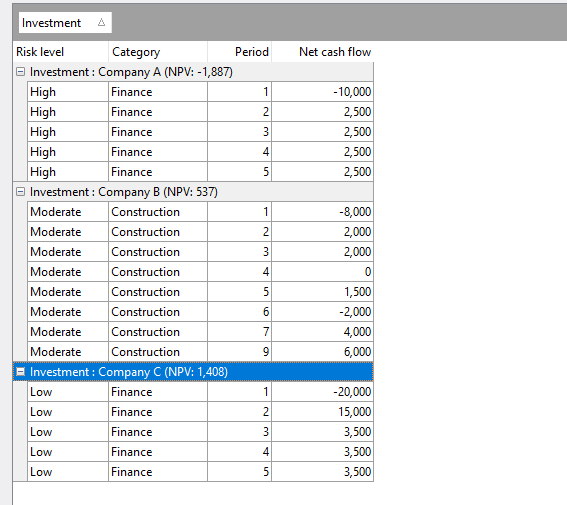
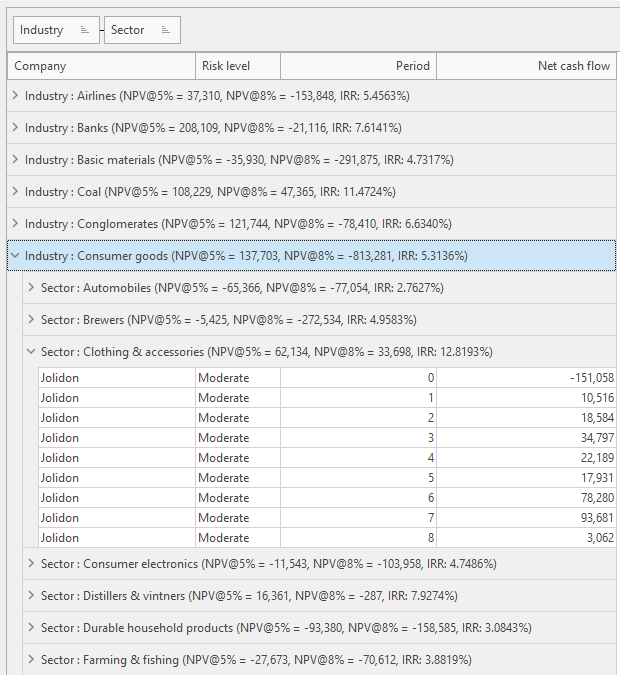
What if we said you could compute and display the NPV and IRR measures like this using Easy Excel Analysis in 60 seconds?

Watch this video to see how.

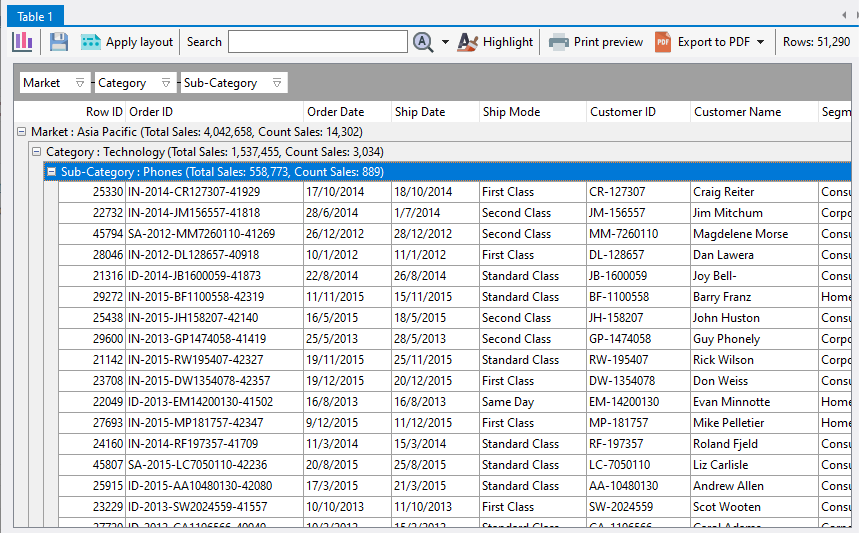
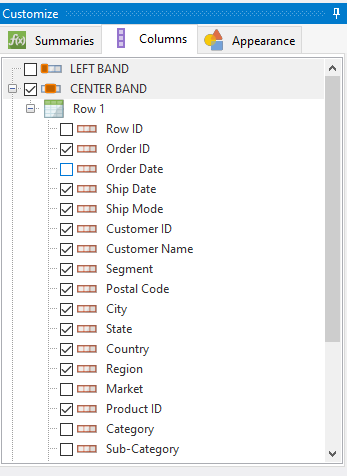
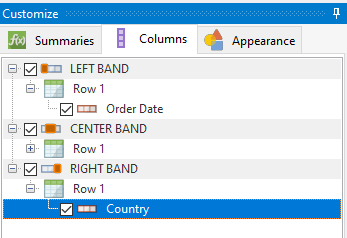
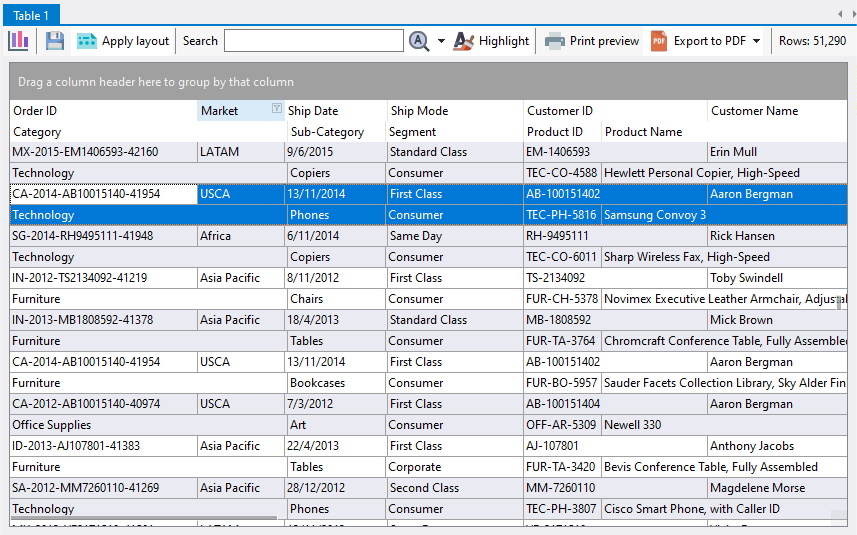
It could not be simpler.  Once you’ve set up the summaries, it’s just a matter of dragging which columns you want to group and compute the measures for.

Download a 14-day trial now, and experience working with your data in ways you never thought possible and gain new insights into your data.

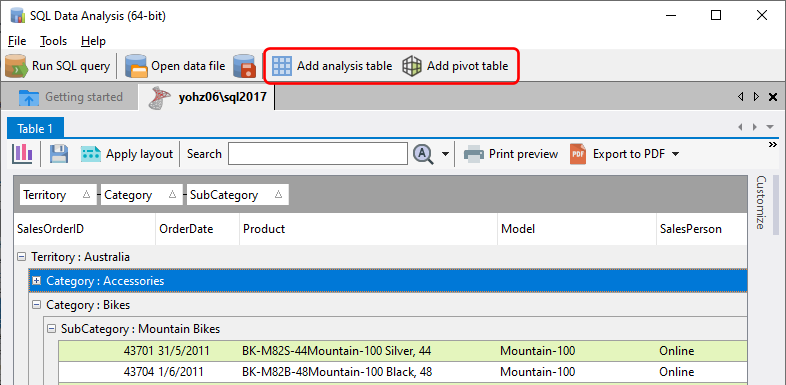
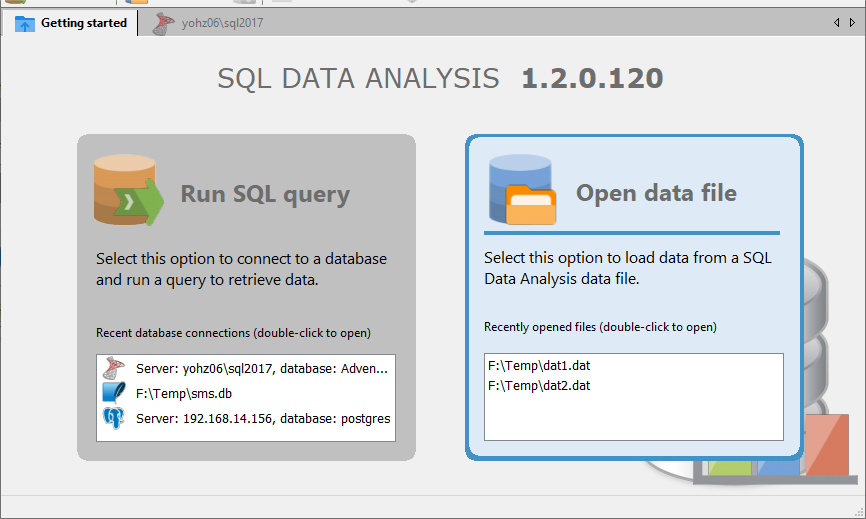
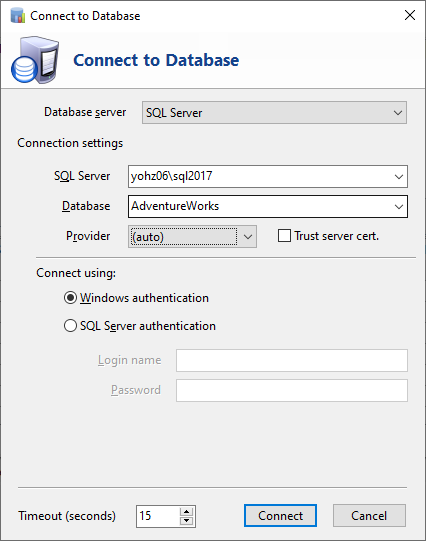
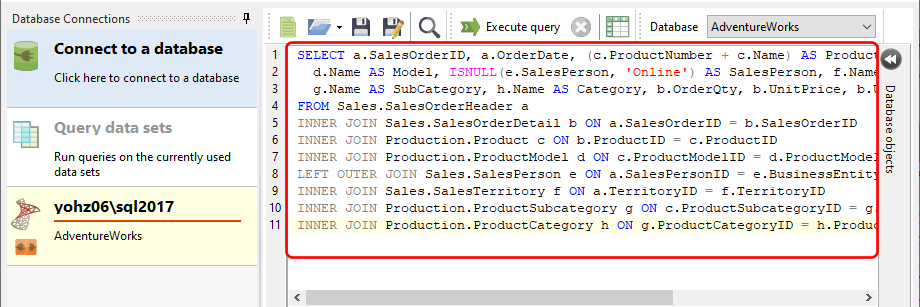
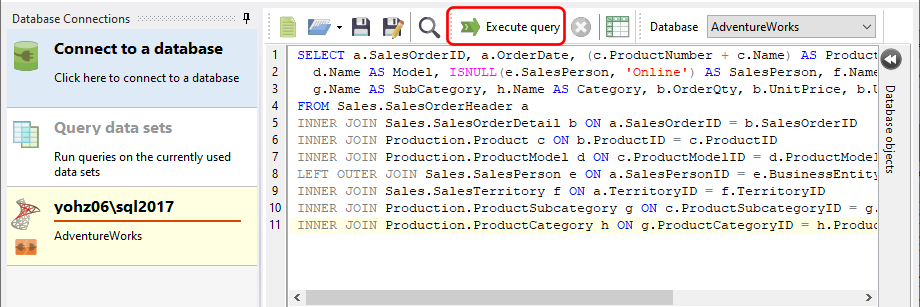
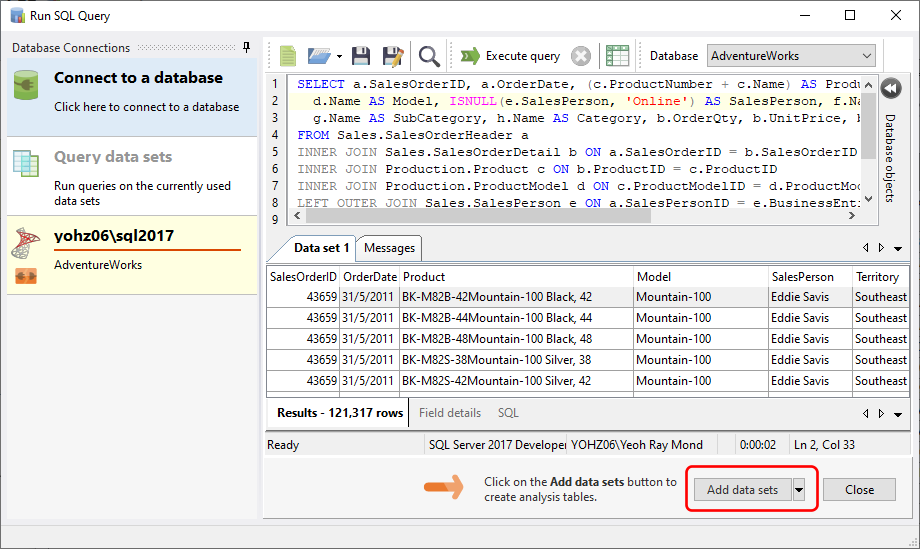
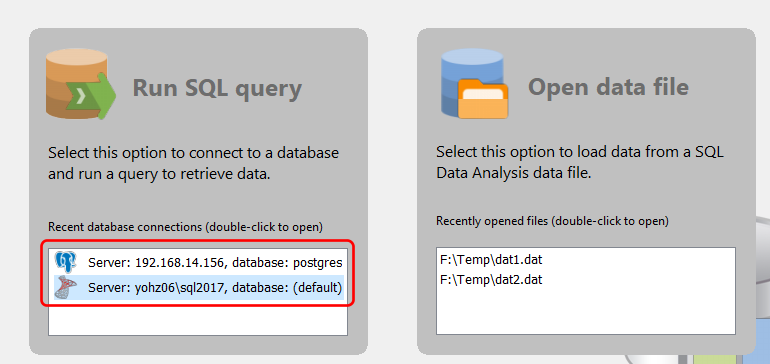
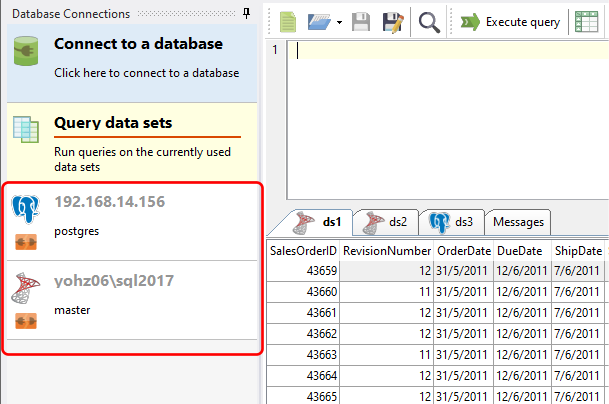
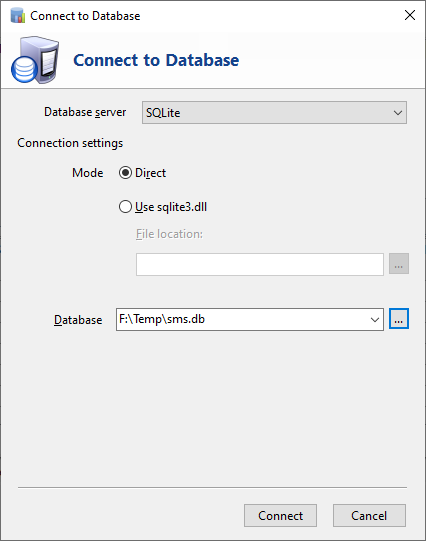
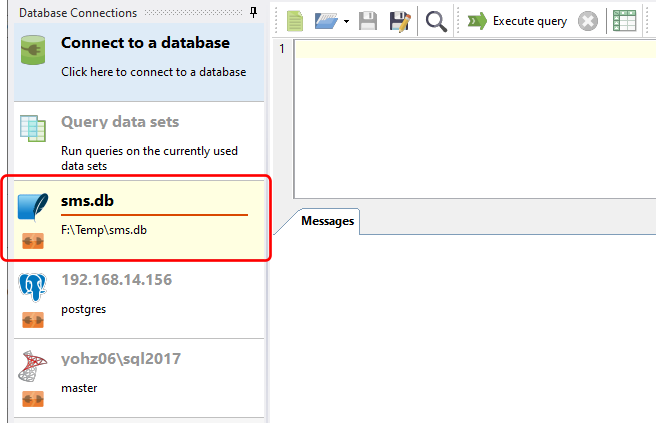
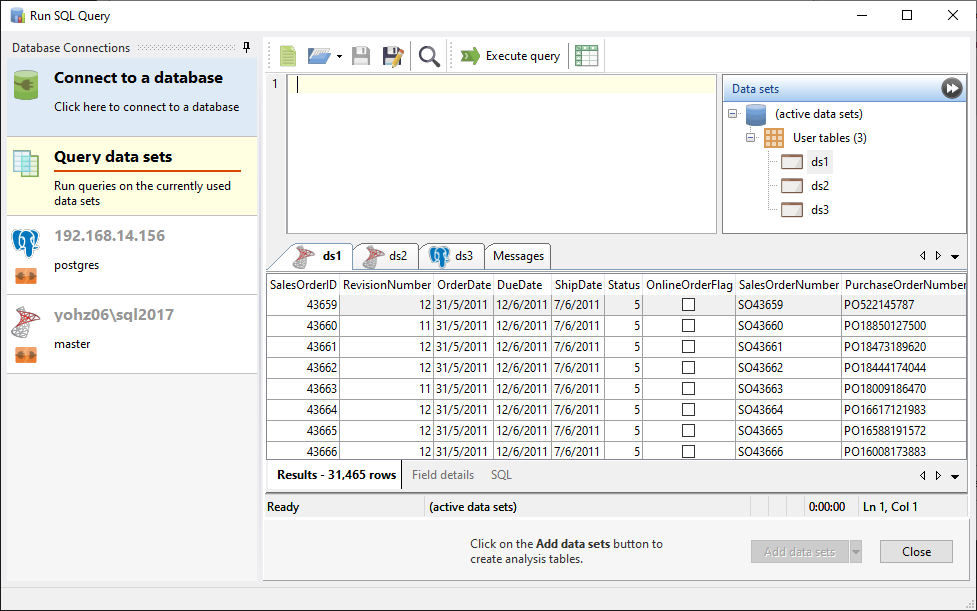
If you need to work with data stored in databases instead of Excel worksheets, then give SQL Data Analysis a try.  It provides the same analysis capabilities as Easy Excel Analysis.

Why do you need to define a period for the IRR, MIRR and NPV financial functions in Easy Excel Analysis and SQL Data Analysis

Easy Excel Analysis and SQL Data Analysis added support for financial functions in version 2.  One quirk you may have noticed is that for the IRR, MIRR, and NPV functions, you need to enter the column containing a period.  Excel doesn’t require this, so why is it required here?

Let’s take a step back and use a simple example in Excel to explain this requirement.  Say we have a single investment we want to calculate the NPV for.  We would list the net cash flow in chronological order and calculate the NPV accordingly.

The point to note is that the order of the net cash flow needs to be sorted by period to be accurate.  If the values were not sorted, we would not get the correct value e.g.

Now say we have to deal with multiple ‘groups’ of investments.

In the example above, we are calculating the NPV for each investment.  In Easy Excel AnalysisSQL Data Analysis, we get the same values when we group our data by the Investment column.

Now say we want to compute the NPV of each category of investment.  In Excel, we can’t just sort by the Category column to compute the NPV.

neither can we just sort by both the Category and Period columns this way:

The correct way is to sum the Net cash flow values for each period by category i.e.

To perform the same computation In Easy Excel Analysis and SQL Data Analysis, we just drag the Category column to the grouping area like this:

That is the reason why Easy Excel Analysis and SQL Data Analysis requires a period value when calculating NPV, IRR and XIRR.  It uses the values in that column to determine how to group the cash flow values when grouping rows together.

To see the NPV value by individual investments,  we just drag the Investment column to the grouping area.  Now we can easily see the NPV per category and per investment.

Thus it’s just a matter of dragging and dropping which columns you want to group by, and Easy Excel AnalysisSQL Data Analysis will calculate the NPV for you at each grouping level.  It could not be easier.

Download a 14-day trial of Easy Excel Analysis or SQL Data Analysis, and start analyzing data in ways you never could in Excel, or would never do because it was too time consuming.

Financial and statistical functions in Easy Excel Analysis and SQL Data Analysis

In Easy Excel Analysis and SQL Data Analysis 2, we added statistical and financial functions to the analysis tables.

To use these functions, right click on the column header you want to compute to bring up the context menu.

Select the advanced item.  This then brings up the Advanced Summary Item window where you can define the data source for the various parameters required for the function you select.

See also:


Working with copies of the same data sets in Easy Excel Analysis and SQL Data Analysis

In Easy Excel Analysis and SQL Data Analysis, you can create multiple analysis tables and/or pivot tables by clicking on the Add analysis table and Add pivot table buttons on the toolbar.

You do not need to re-import the Excel/CSV file (in Easy Excel Analysis) or re-run the query (in SQL Data Analysis).  Each analysis table and pivot table is independent, and you can customize the layout of each analysis and pivot tables to your needs.

Because each analysis/pivot table consumes memory resources, the number of tables you can create from each data set is determined by your settings.  In Easy Excel Analysis, this limit is set in the Data loading settings in the Import file wizard.

In SQL Data Analysis, the limit is set in the Data options settings.

You can increase this limit if you need to be able to create more analysis/pivot tables per data set, and your machine has the available memory capacity.

SQL Data Analysis guide

The SQL Data Analysis Getting Started Guide

getting started
Explains how to connect to a database, run a query, and use the data set in an analysis table.

connecting to database servers
Explains how to connect to your database server in greater detail.

using data files
Explains data files, and how they can be used to share data with other users without having to grant them access to your databases.

running internal queries
Explains how SQL Data Analysis allows you to run SQL queries on data sets retrieved from different database servers.

using analysis tables
Explains how to create groups, summaries, and use charts with your data sets.

working with copies of the same data sets
Explains how you can create multiple analysis and pivot tables from the same data set without having to repeatedly run the same query.

working with analysis table columns
Explains how to hide and freeze columns, and create multi-row headers in your analysis tables.

working with charts
Explains how charts can be used to get a big picture analysis of your data set, and used as a navigation tool to support the analysis table.


Using data files in Easy Excel Analysis and SQL Data Analysis

In Easy Excel Analysis and SQL Data Analysis, you can save data sets to an external file, which you can then use later without having to import the Excel/CSV file again (for Easy Excel Analysis) or connect to your database and running the SQL query again (for SQL Data Analysis).

Another use for data files is to be able to share data with your users, who can use Easy Excel Analysis or SQL Data Analysis to open the file.  In the case of SQL Data Analysis, you can provide them the required data to analyse without having to grant them access to the underlying database.

To save a data set to a data file, you must already be using the data set, either in an analysis table or pivot table.

Click on the Save analysis data button, and enter a file name to save the data in.

Opening a data file

To open a data file, click on the Open data file button,

or click on the Open data file item on the main page.


Getting started with SQL Data Analysis

To create an analysis table from a data set using SQL Data Analysis, here are the basic steps to follow:

Connect to your database

Click on the Run SQL query item from the SQL Data Analysis main screen.

Click on the Connect to a database item in the Database Connections panel.

Enter the connection details in the Connect to Database window and click Connect.

Run your SQL query

Enter the query you want to run in the SQL editor window for your connection.

Click on the Execute query button to run your query.

Once the data set has been retrieved, click on the Add data sets button to create an analysis table using that data set.

See also:


Connecting to your database in SQL Data Analysis

SQL Data Analysis supports the following databases:

  • PostgreSQL 8.0 onwards
  • MySQL and MariaDB 4.0 onwards
  • Oracle 8.0 onwards
  • SQL Server 7 onwards
  • SQL Server Compact 3.1 onwards
  • SQL Azure
  • SQLite 3.0 onwards
  • Microsoft Access 2000 onwards
  • Firebird 1.x onwards
  • ODBC supported databases

To connect to a database, click on the Run SQL query item:

Details of previous connections are also listed, and you can double-click on the connection item to re-open that connection.

In the Run SQL Query window, a list of existing connections will be displayed on the left.

To establish a new connection, click on the Connect to a database item.  Enter the connection details, and click Connect.

On a successful connection, a new query window will be created.  The active connection will be highlighted in the Database Connections panel.

Enter your SQL queries in the editor window, and click on the Execute query button (or press F5) to run your query.

See also:

Querying the used data sets in SQL Data Analysis

In SQL Data Analysis, you can run queries on the data sets that you are using.  For example, you may have retrieved a data set from a SQL Server database, and another data set from a PostgreSQL database.  You can run a query to retrieve data from these 2 data sets as if they were tables in a database.

To run an internal query, first click on the Run SQL query item in the main window.  In our example, we have already ran and use data sets from SQL Server and PostgreSQL databases.

Select the Query data sets item on the Database Connections panel on the left.  There are 3 ‘tables’ we can query from – ds1, ds2, and ds3.  You can write a query to retrieve rows across these 3 tables e.g.

The new data set can then be used in your analysis tables and pivot tables.

The SQLite SQL syntax is used for the internal query.  Thus, you have access to almost all the standard SQL92 syntax, except for RIGHT OUTER JOIN and FULL OUTER JOIN.


Working with analysis table columns

Once you have imported a data set into Easy Excel Analysis or SQL Data Analysis, an analysis table is created.  Here, we will described how to work with the analysis table columns.  We will be using the global superstore 2016.xlsx file for reference.

Creating summaries

To create summaries, please refer to this post on how to create group and footer summaries.

Hiding columns

To hide or display columns, open the Columns tab of the Customize panel.  Select a column to make it visible, or deselect it to hide the column.

Freezing columns

In Easy Excel Analysis or SQL Data Analysis, you can freeze columns on the left and right of the analysis table e.g. in the table below, the Order Date column is frozen on the left, and the Country column is frozen on the right.

When you scroll the table horizontally, these 2 columns will remain fixed in their position.

To freeze columns, first ensure that the LEFT BAND and/or RIGHT BAND items are selected in the Customize panel.

Then drag and drop columns onto either of those 2 items to freeze the columns in those bands.

Stacking columns

You can stack columns by dragging them to a new column row, to create layouts like this:

Notice that the Category, Sub-Category, Segment, Product ID, and Product Name columns are displayed on the second row.

To stack columns, click on a column header and drag it to below the row where you want to create a new row.  You will create a new row if you see the green horizontal indicator arrows.  In the example below, we are dragging the Category column to create a new row.