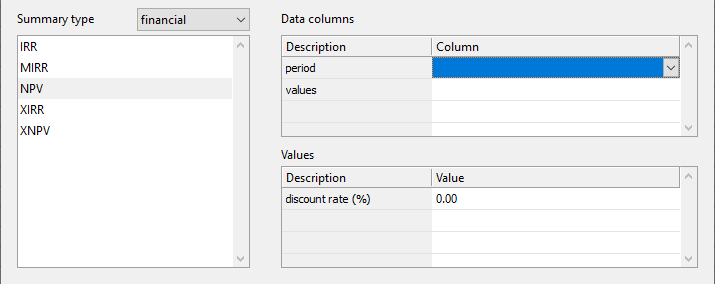
Easy Excel Analysis and SQL Data Analysis added support for financial functions in version 2. One quirk you may have noticed is that for the IRR, MIRR, and NPV functions, you need to enter the column containing a period. Excel doesn’t require this, so why is it required here?
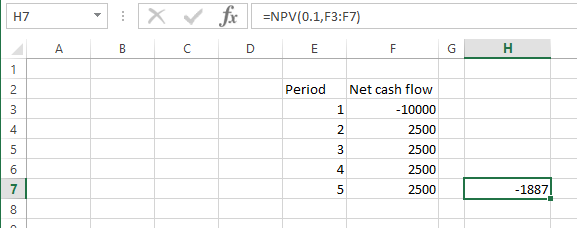
Let’s take a step back and use a simple example in Excel to explain this requirement. Say we have a single investment we want to calculate the NPV for. We would list the net cash flow in chronological order and calculate the NPV accordingly.
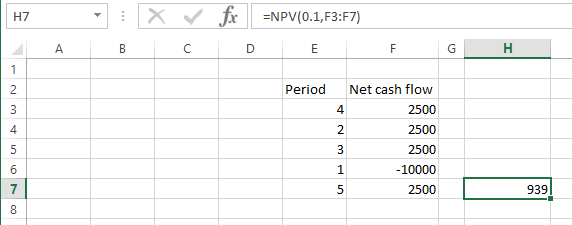
The point to note is that the order of the net cash flow needs to be sorted by period to be accurate. If the values were not sorted, we would not get the correct value e.g.
Now say we have to deal with multiple ‘groups’ of investments.
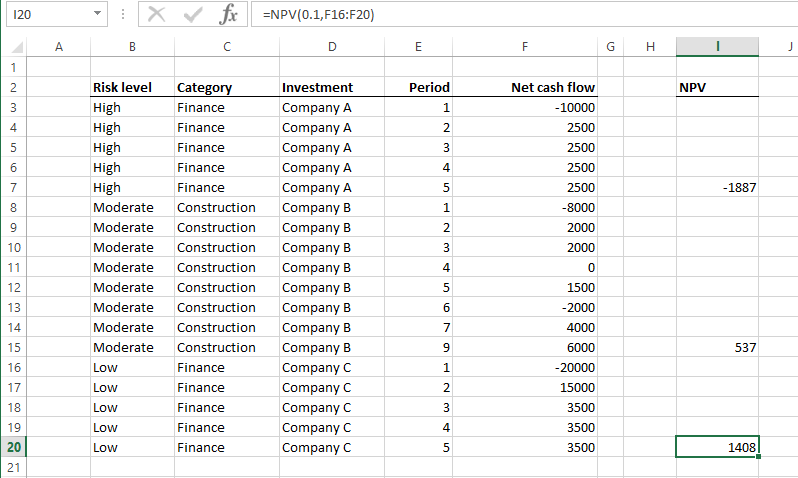
In the example above, we are calculating the NPV for each investment. In Easy Excel Analysis / SQL Data Analysis, we get the same values when we group our data by the Investment column.
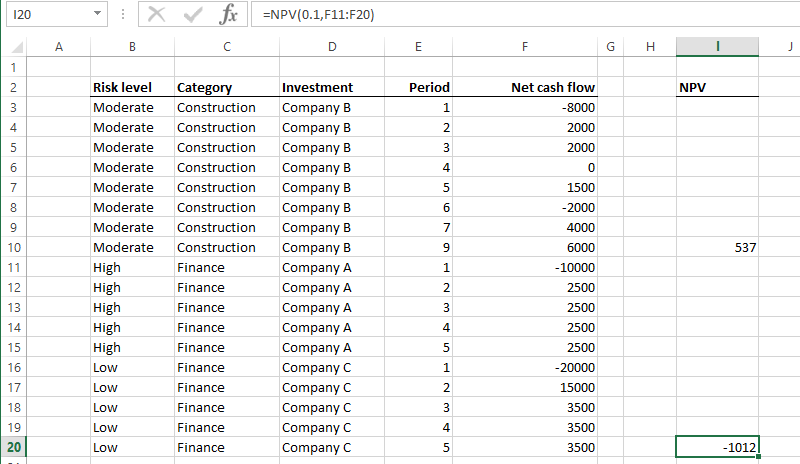
Now say we want to compute the NPV of each category of investment. In Excel, we can’t just sort by the Category column to compute the NPV.
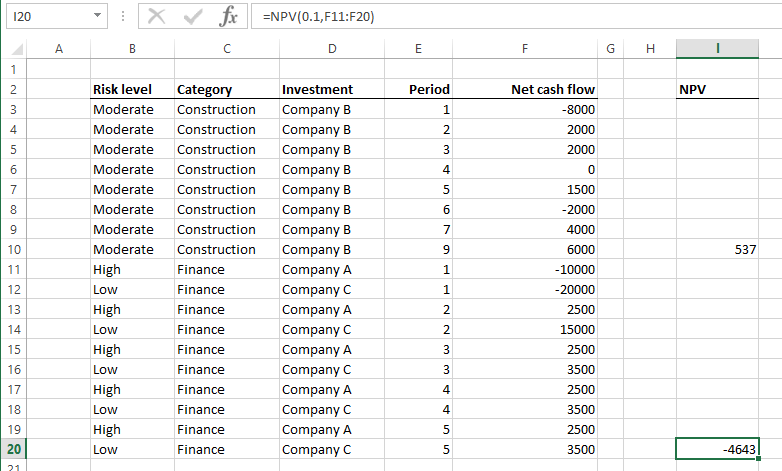
neither can we just sort by both the Category and Period columns this way:
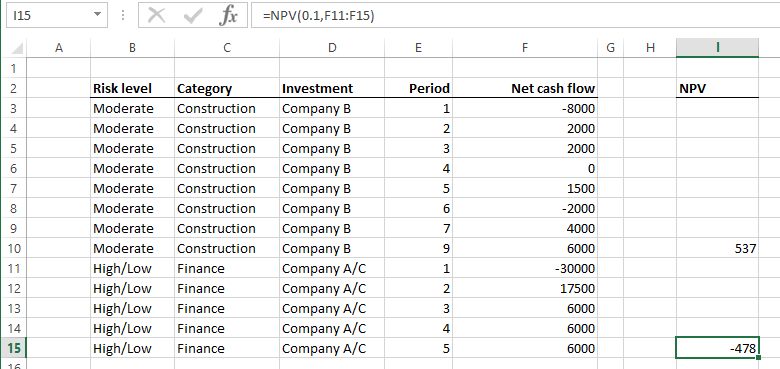
The correct way is to sum the Net cash flow values for each period by category i.e.
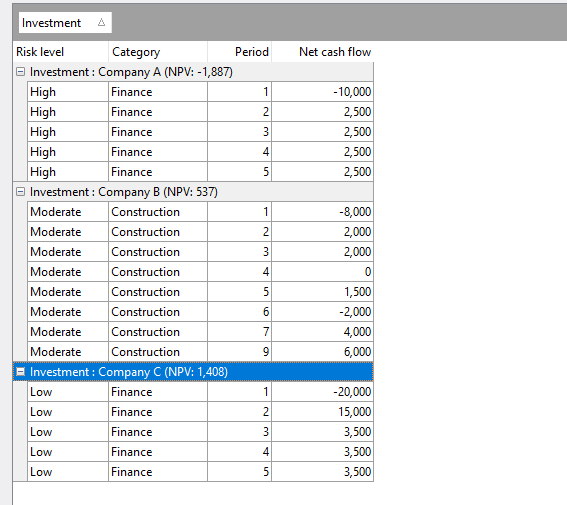
To perform the same computation In Easy Excel Analysis and SQL Data Analysis, we just drag the Category column to the grouping area like this:
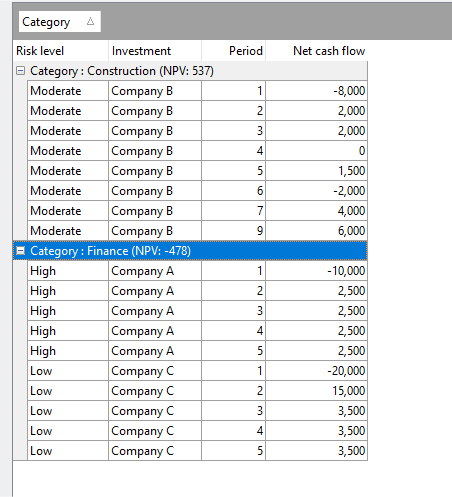
That is the reason why Easy Excel Analysis and SQL Data Analysis requires a period value when calculating NPV, IRR and XIRR. It uses the values in that column to determine how to group the cash flow values when grouping rows together.
To see the NPV value by individual investments, we just drag the Investment column to the grouping area. Now we can easily see the NPV per category and per investment.
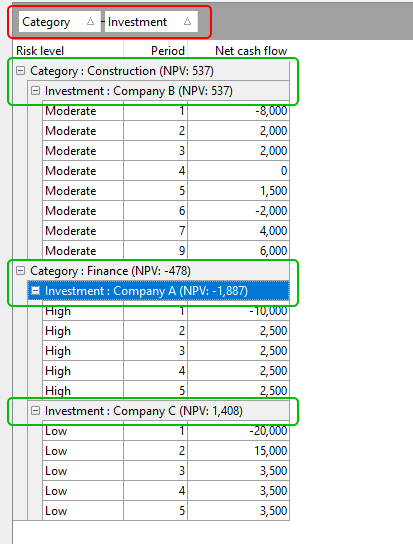
Thus it’s just a matter of dragging and dropping which columns you want to group by, and Easy Excel Analysis / SQL Data Analysis will calculate the NPV for you at each grouping level. It could not be easier.
Download a 14-day trial of Easy Excel Analysis or SQL Data Analysis, and start analyzing data in ways you never could in Excel, or would never do because it was too time consuming.