Monthly Archives: February 2021

Importing data in Easy Excel Analysis – sample walk-through

In this walk-through, we will be importing data from 13 Excel files containing financial transactions.  The end-result will allow us to compute summary values for a single grouped column e.g.
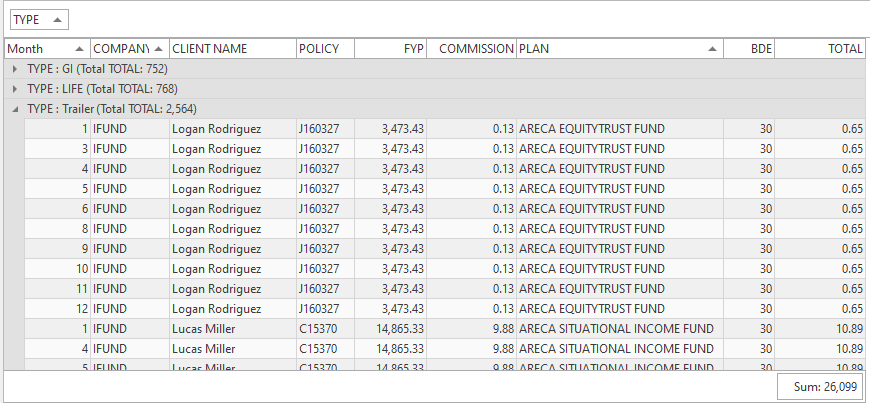
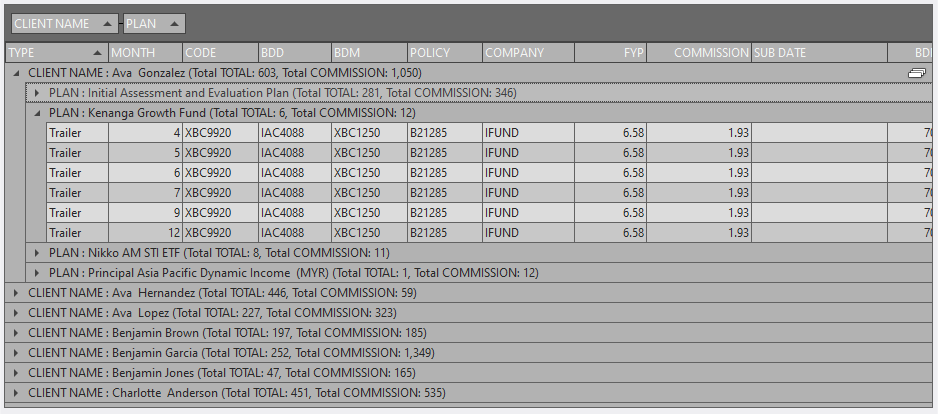
and for multiple levels of grouping e.g.
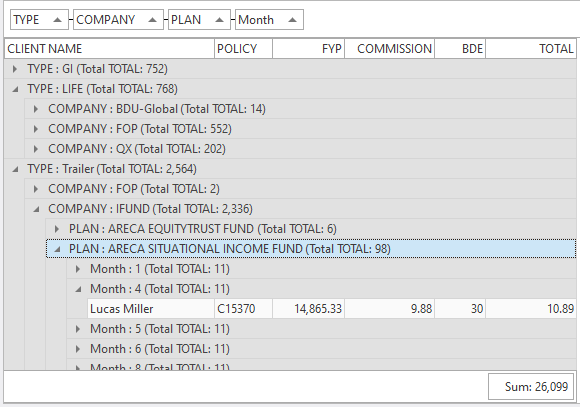
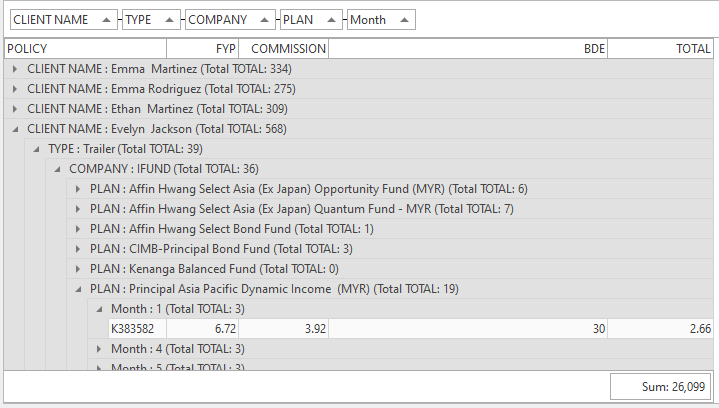
or
Prerequisites

Install Easy Excel Analysis using the installer located here.

The source Excel files

Our source files consist of 13 Excel files, each containing data for one month, except for February which consists of 2 files.
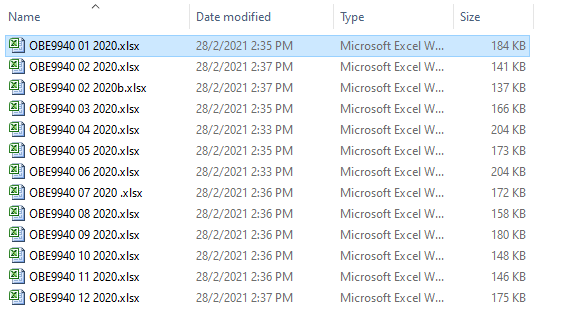
Note that the each file identifies the month the data belongs to in its naming convention e.g. OBE9940 01 2020.xlsx indicates that the data in this file is for January, and OBE9940 12 2020.xlsx is for December.

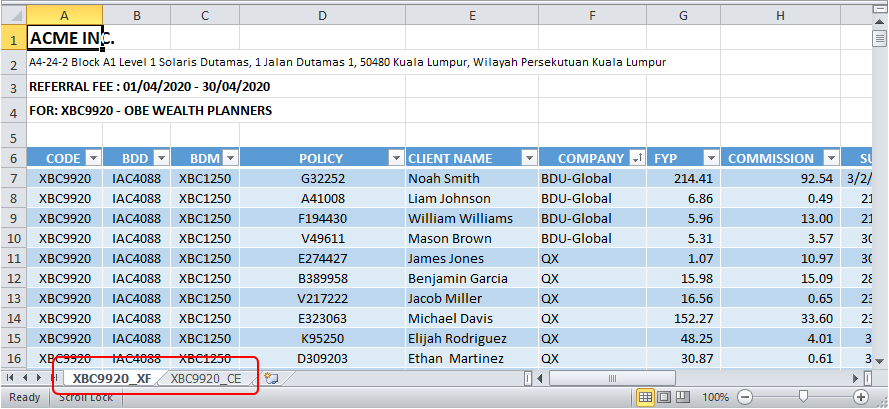
Each Excel file contains 2 worksheets.  We will be importing data from the first worksheet.
Importing the data

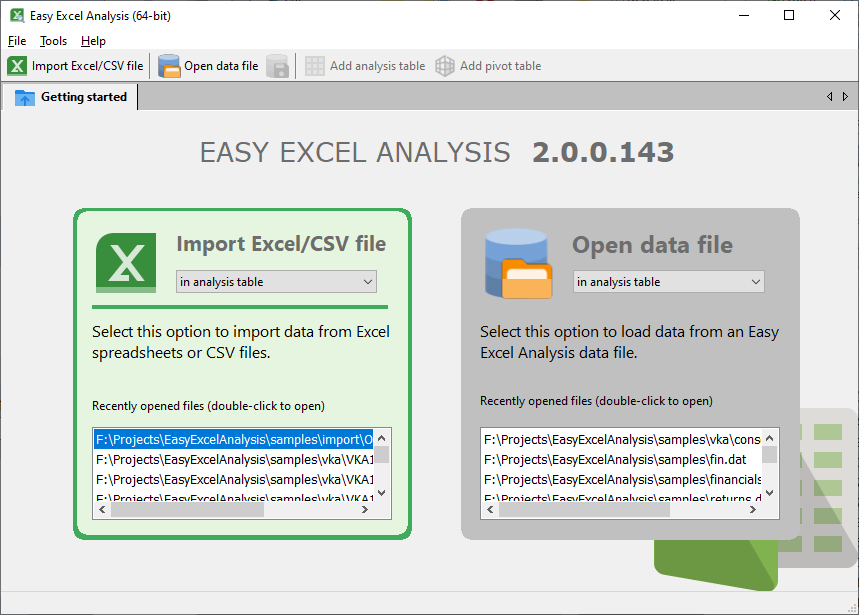
Open Easy Excel Analysis.  Click on the Import Excel/CSV file box.
Select the first Excel file to import.  This will be our primary source file.  Easy Excel Analysis opens the file and displays the first 50 rows.
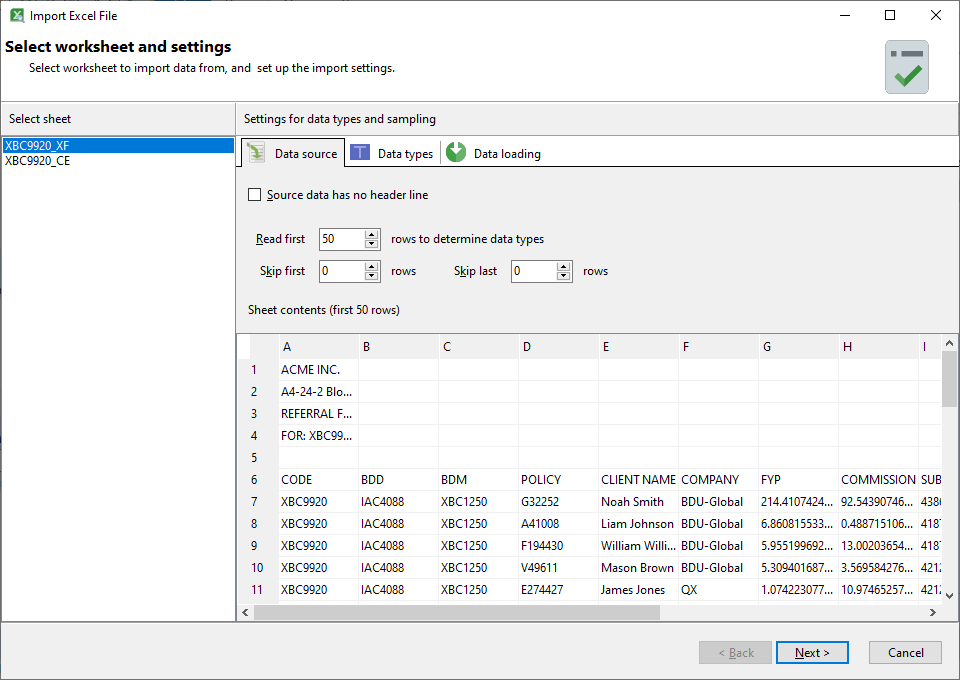
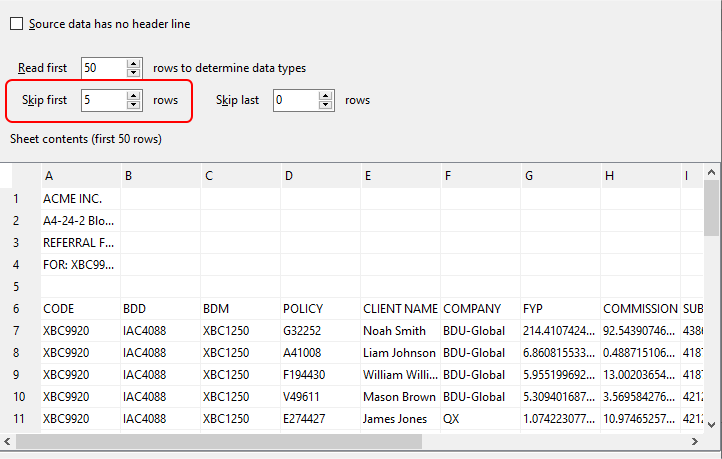
The list of available sheets are displayed on the left, and the first sheet is selected by default.  Our source file contains some header details, and the actual data only starts from the 6th row.

Thus, we need to set the Skip first value to 5.
Our source file also contains a total at the end of our data block.
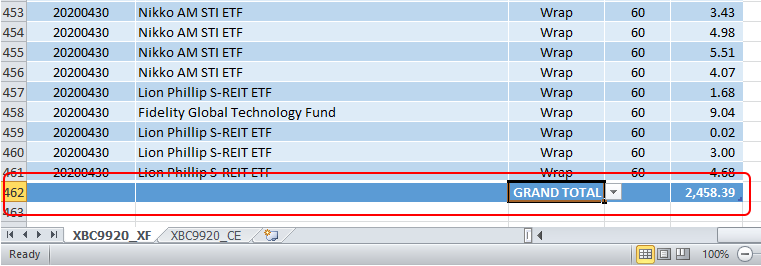
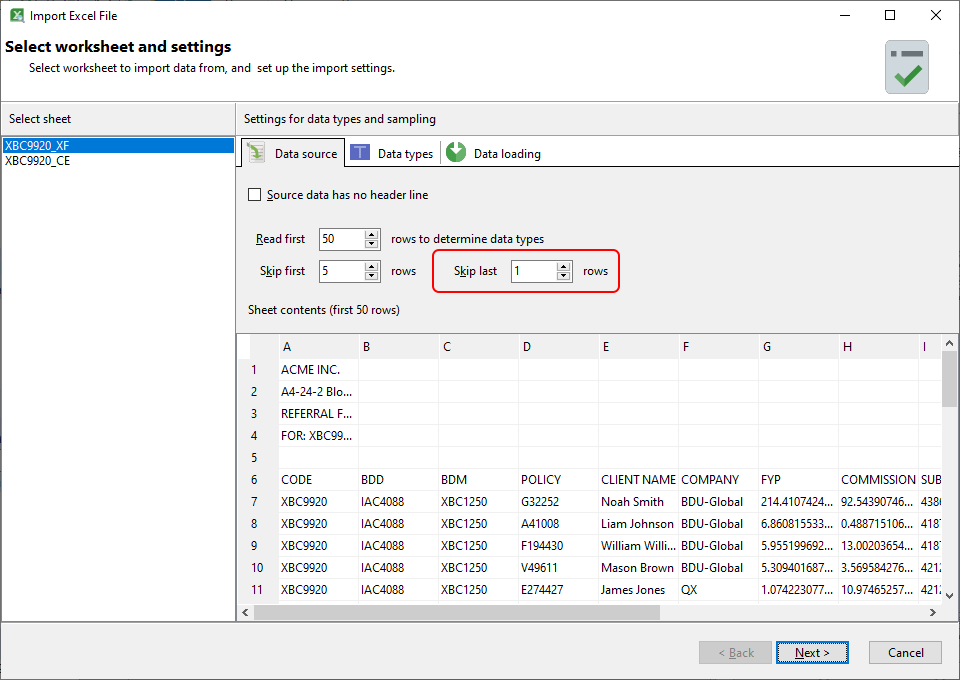
As we do not require this row, we need to set the Skip last value to 1 so that Easy Excel Analysis ignores this row.
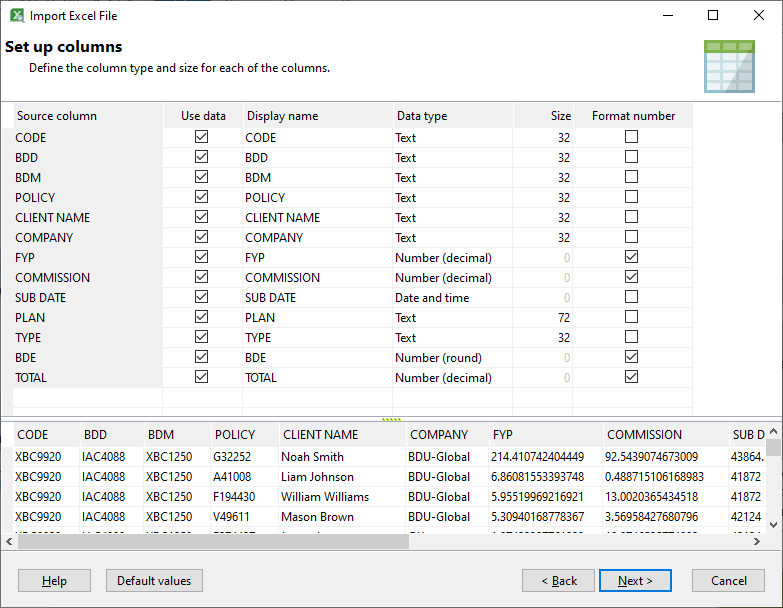
Click Next and ensure that the column types have been identified correctly.
Click Next.  Here, we can set up derived values from the date columns in our data set.  We will skip this step.
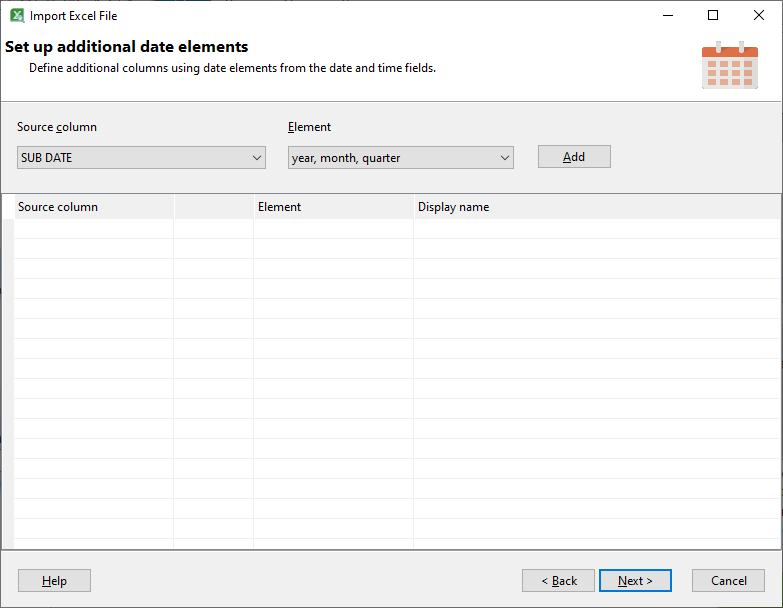
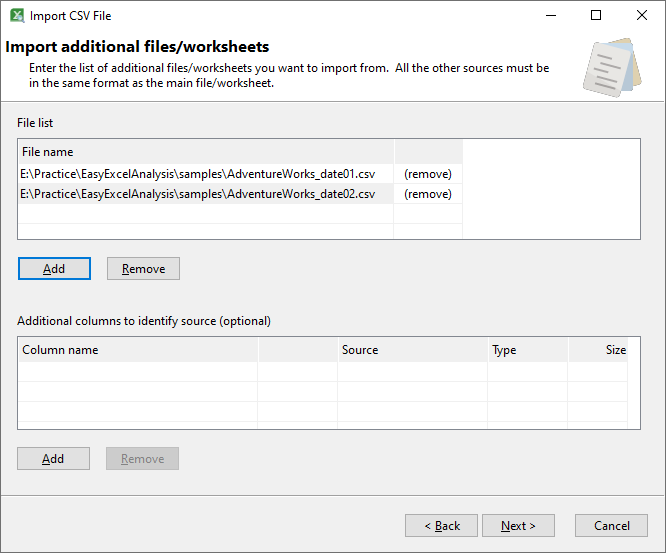
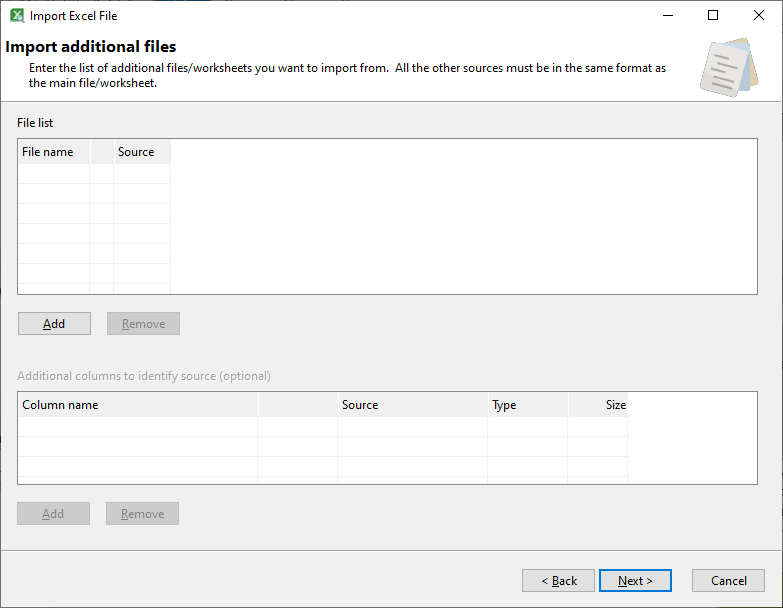
Click Next.  Here, we can enter the other files we want to import.  Click on the Add button.
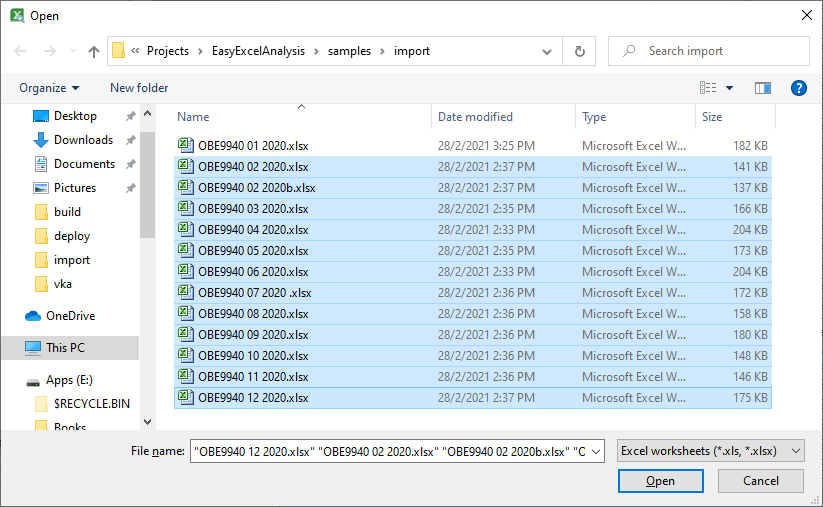
Select the files we want to import.  You can use the CTRL and SHIFT keys when clicking on the file names to select multiple files.  Click Open once you have selected the files.
The selected files are listed, and the default option is to import the data from the sheet of the same name as our primary source file.
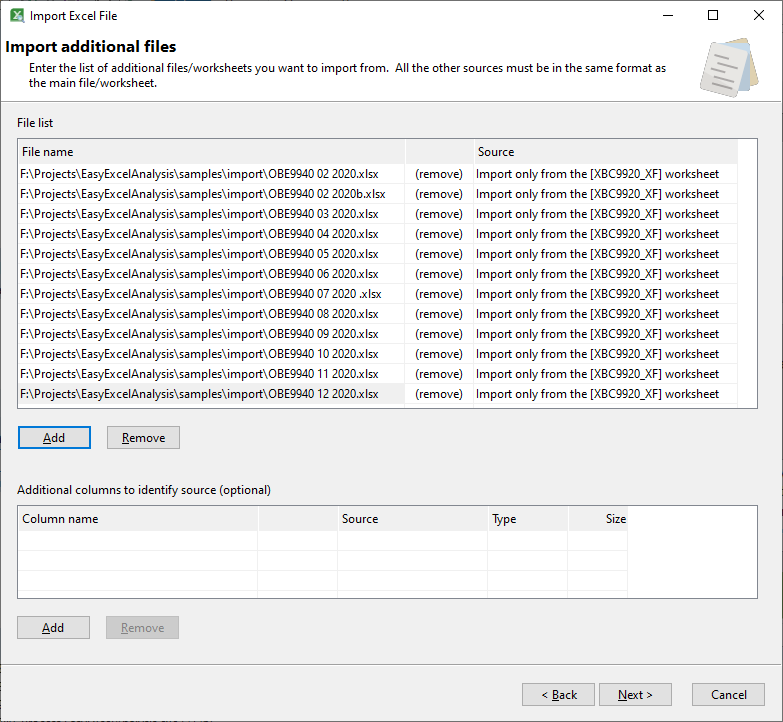
Unfortunately, our source files do not have a consistent naming convention with regards to the sheet names.  Thus, we will need to change the import option to import only from sheet 1.
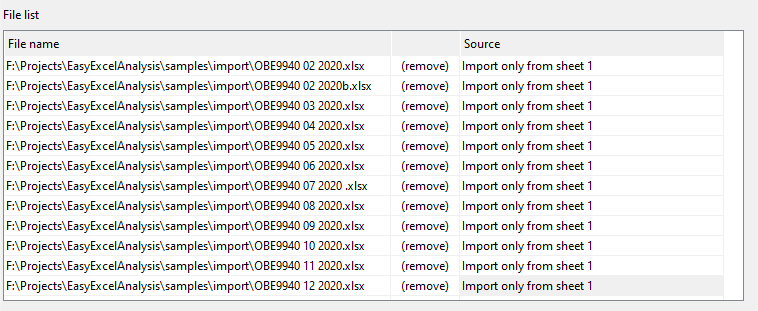
Our source files do not contain any values that identify the month each transaction.  Thus, if we import the data now, we cannot identify which month  the transaction belongs to.  As this information is important to us, we need to add an additional column to our combined data.

We can either open each worksheet and add a column containing the month value, or add a new column using Easy Excel Analysis.  To do that, click on the Add button in the additional columns section.

This brings up the Add additional column window.
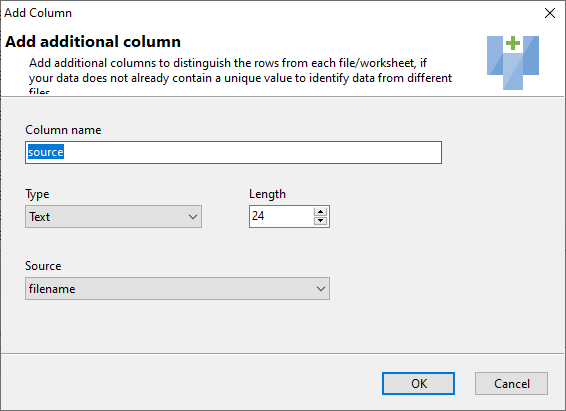
We will name this column MONTH.  As we will be getting the value for this column from our file name (recall that our file names contain the numeric month value), we will specify a number type.  The month value in our files names is the 2nd value, so we select the filename 2nd value as the source for this column.
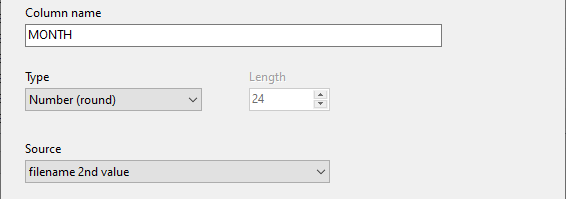
Easy Excel Analysis recognizes spaces, dashes, and underscores as separators for values, so any of these file names in our example would provide the correct month value.

  • OBE9940 01 2020.xlsx
  • OBE9940-01-2020.xlsx
  • OBE9940_01_2020.xlsx

Click Next , and Easy Excel Analysis will then start importing from our primary source file and the additional files we listed.

Analyzing the data

Once the data has been imported, you can start grouping and summarizing the values.  Let’s start by creating a group summary value for the TOTAL column.

Right click on the TOTAL column header.  Select the Add group header summary item, then the sum function.
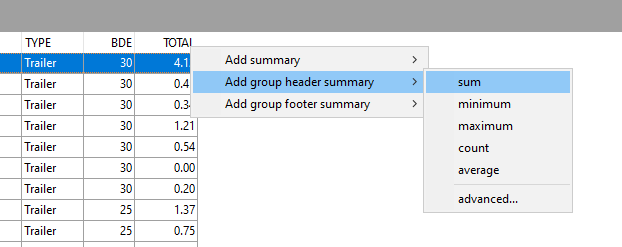
In the Summaries listing on the right panel, you should now see that a summary has been created for the TOTAL column, using the sum function.
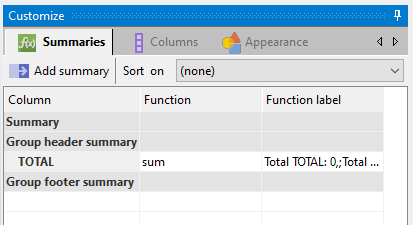
Now drag and drop the TYPE column header to the column grouping area.

The data rows are now grouped by TYPE, and the summary values calculated for each TYPE value.

Expanding any of the TYPE value will display the details for that value.
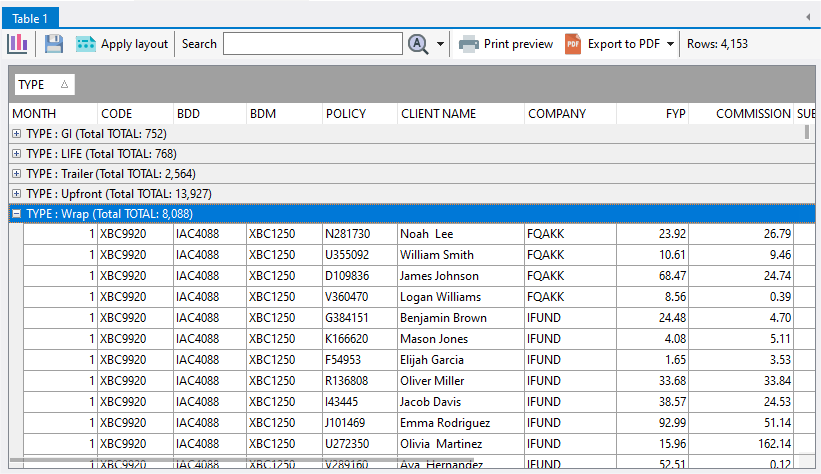
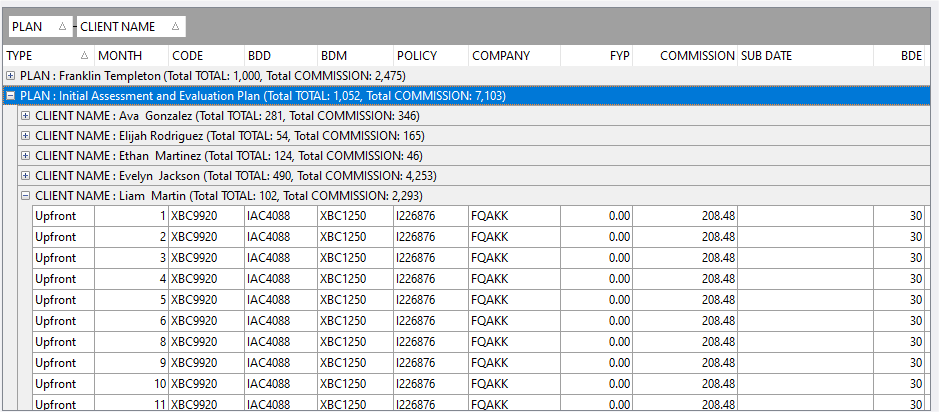
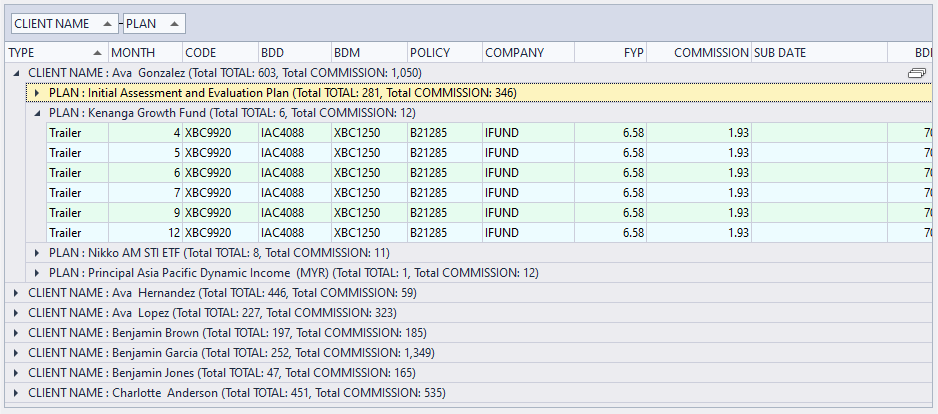
We can create as many grouping levels as we require simply by dragging and dropping the columns into the grouping area.  Say we want to see how much we earn from each client, then by each plan.  We just need to place the CLIENT NAME and PLAN columns into the grouping area.
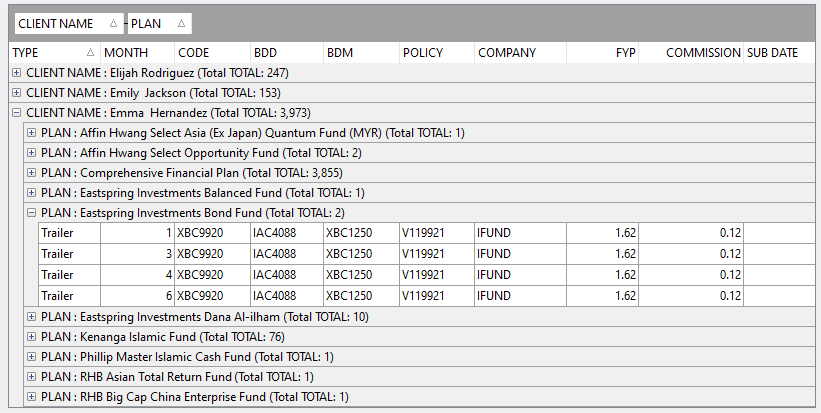
We can create additional summary values using the same steps for the TOTAL column.  Say we want to display the total COMMISSION value at each grouping level.  We right click on the COMMISSION column header, select the Add group header summary item, then the sum item.
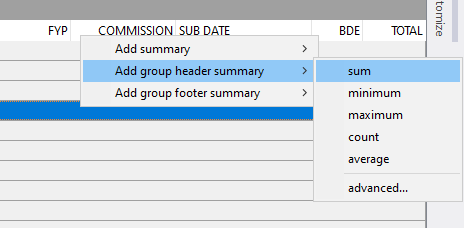
The summary is then calculated and displayed immediately for each group.
Saving the grouping layout

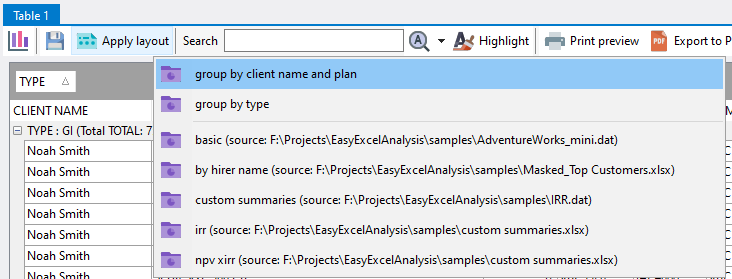
You can save each grouping layout by clicking on the Save current layout button.

Enter a name for the layout.  You can then later apply each saved layout by clicking on the Apply layout button and select the grouping layout you want to use.
Saving the data for future use

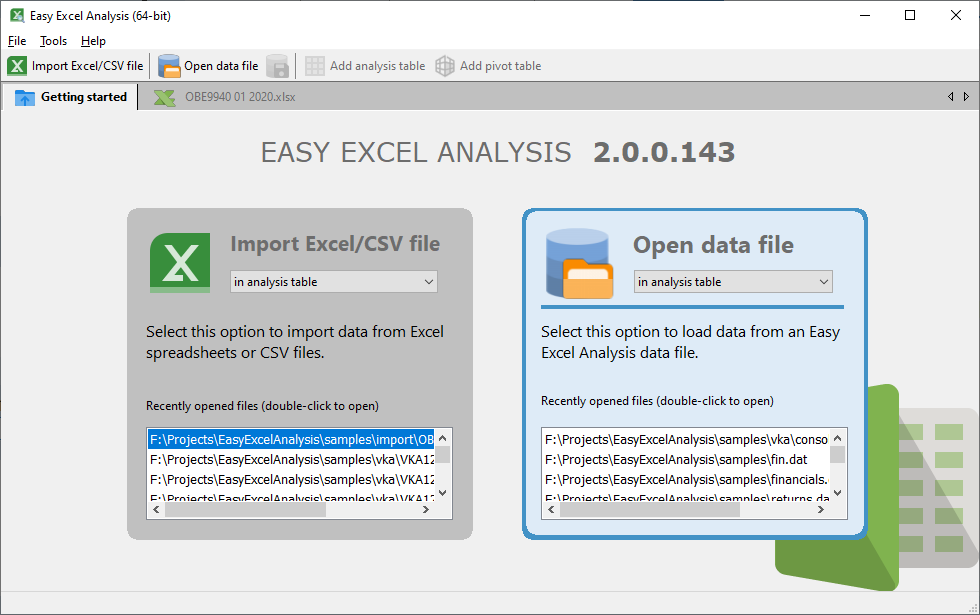
To save this consolidated data, click on the Save the current analysis data to a data file item, and enter a file name.

The next time you want to analyze this set of data, click on the Open data file box in Easy Excel Analysis and select the data file.
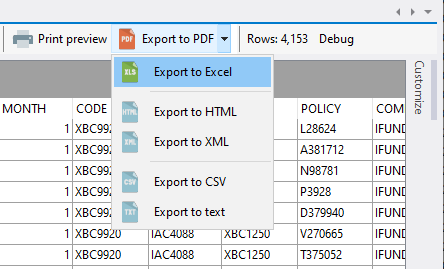
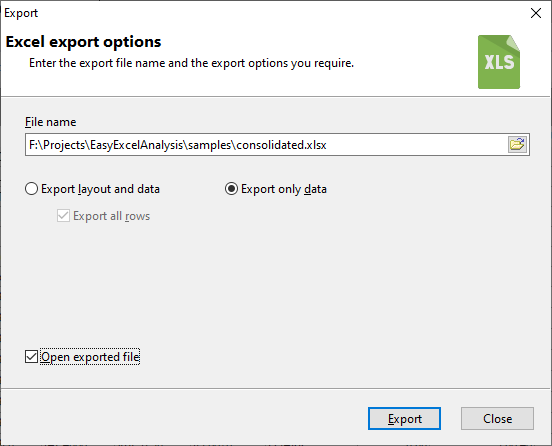
You can also save the consolidated data to an Excel worksheet.  Click on the Export to Excel item in the Export options.
Enter the file name, and the layout or data option.
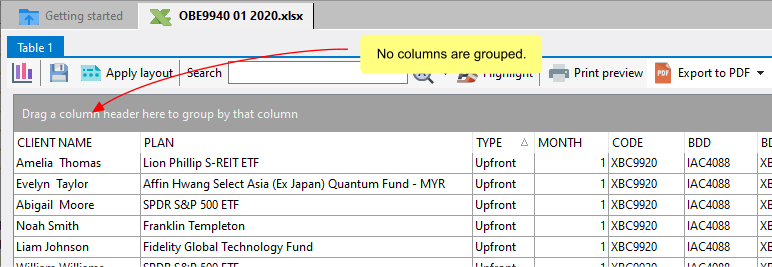
If you want to export only the rows without any grouping applied, ensure that your analysis table does not contain any grouping rows before you start the export.
Customizing the appearance

The Appearance tab on the Customize panel allows you to change the appearance of the displayed data.
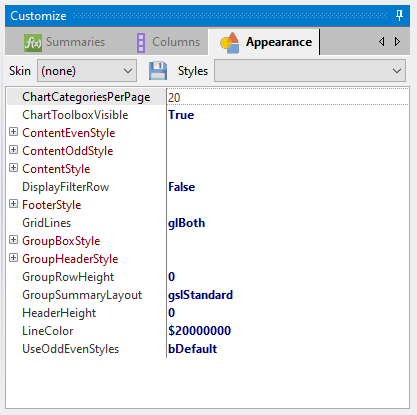
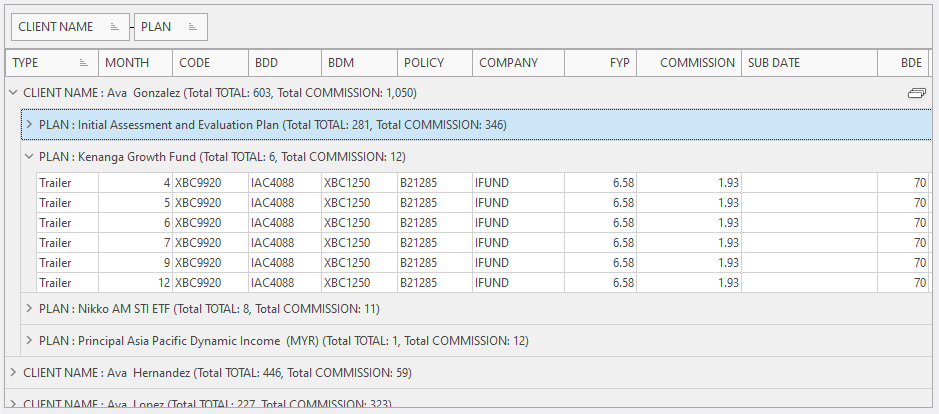
The Skin option allow you to quickly change the look of the data e.g.
 

Overcoming Excel (and other product) technical limitations using Easy Excel Analysis

We recently had an interesting support call from an Easy Excel Analysis trial user, who described to us various ‘interesting’ technical issues, which we were happy to solve.

Excel’s worksheets are limited to a million rows.  The user wanted to analyze data spread over 4 Excel files, totaling over 1.7 million rows.  So she used another application that was supposedly able to combine all the rows from the Excel files, and export them into a single CSV file.

Unfortunately, that application failed for unknown reasons.  So while she was interested in evaluating Easy Excel Analysis, she felt stuck because she couldn’t consolidate all the 1.7 million rows from the 4 Excel files into a single CSV file.  She was also unsure if Easy Excel Analysis could handle that many data rows.

First off, in Easy Excel Analysis, you can work with a data set containing millions or tens of millions of rows, as long as your computer system has adequate RAM and a fairly good CPU.  For e.g. to work with 1.7 million rows, you would require approximately 6 GB of RAM to work comfortably.

Secondly, Easy Excel Analysis can import data from multiple Excel files and combine them into a single data set.  The user did not need to consolidate the data herself.  She just needed to prepare the settings to import the first Excel file, then enter the names of the additional files to import from.

In this way, you can combine the data from one or more Excel files without having to rely on other applications.

Once she was able to do that, she still wanted to export the data to a CSV file.  Guess what?  She can do that in Easy Excel Analysis too.  Just select the Save the current analysis data to a data file option, and all 1.7 million rows is exported to a single CSV file.

So as it turns out, all the questions related to the technical aspects of getting data into and out of Easy Excel Analysis, which was solved without much fuss.

Download a 14-day trial and give Easy Excel Analysis a try.  You might just find new ways to work with your data you previously thought impossible.

Why do you need to define a period for the IRR, MIRR and NPV financial functions in Easy Excel Analysis and SQL Data Analysis

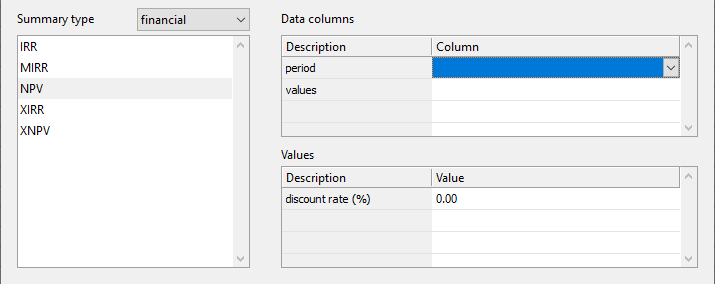
Easy Excel Analysis and SQL Data Analysis added support for financial functions in version 2.  One quirk you may have noticed is that for the IRR, MIRR, and NPV functions, you need to enter the column containing a period.  Excel doesn’t require this, so why is it required here?

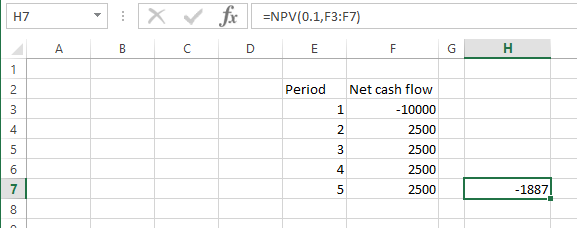
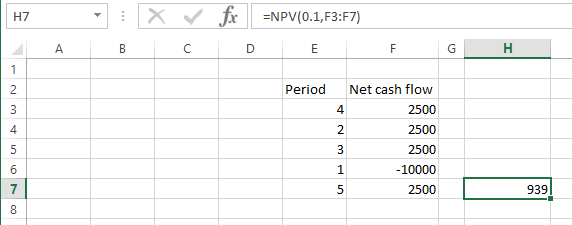
Let’s take a step back and use a simple example in Excel to explain this requirement.  Say we have a single investment we want to calculate the NPV for.  We would list the net cash flow in chronological order and calculate the NPV accordingly.

The point to note is that the order of the net cash flow needs to be sorted by period to be accurate.  If the values were not sorted, we would not get the correct value e.g.

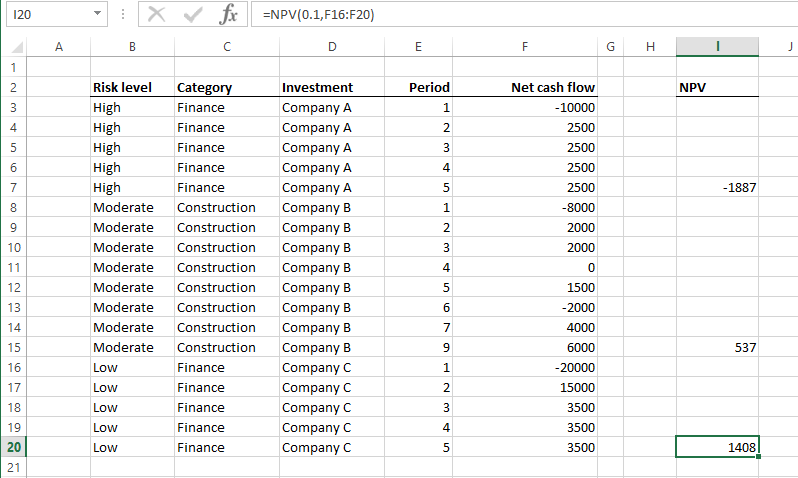
Now say we have to deal with multiple ‘groups’ of investments.

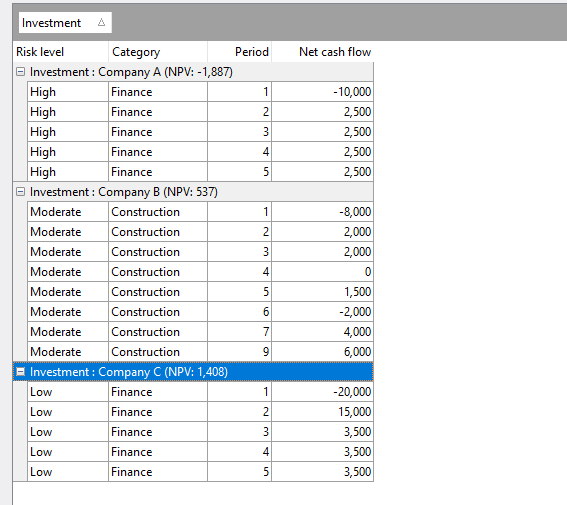
In the example above, we are calculating the NPV for each investment.  In Easy Excel AnalysisSQL Data Analysis, we get the same values when we group our data by the Investment column.

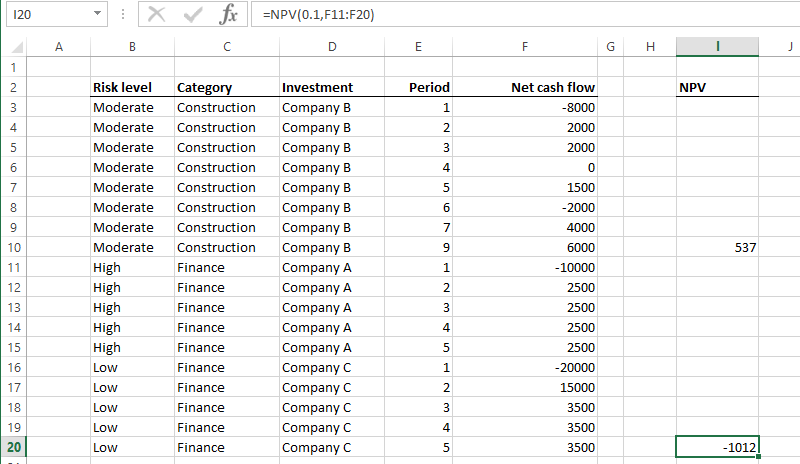
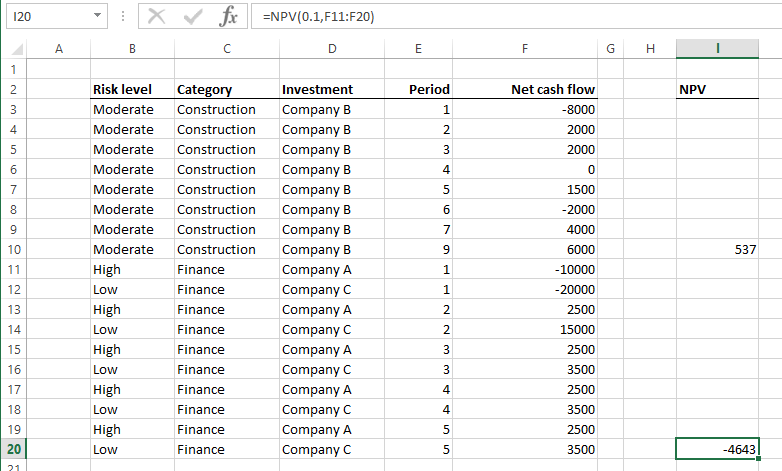
Now say we want to compute the NPV of each category of investment.  In Excel, we can’t just sort by the Category column to compute the NPV.

neither can we just sort by both the Category and Period columns this way:

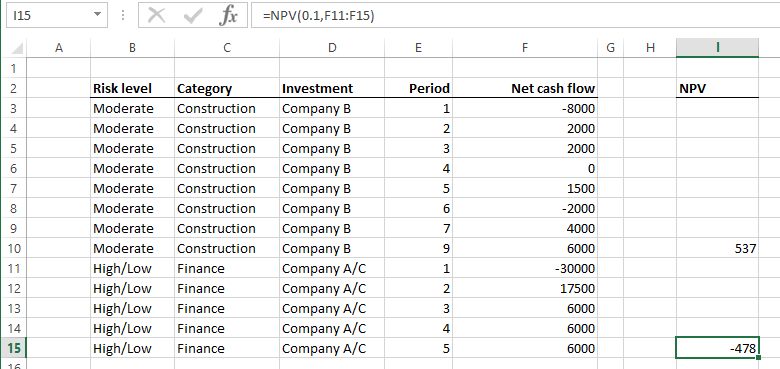
The correct way is to sum the Net cash flow values for each period by category i.e.

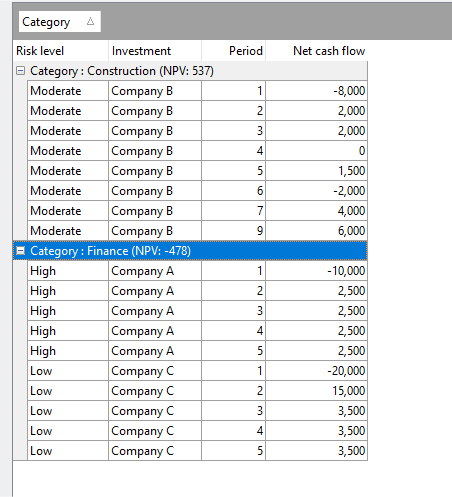
To perform the same computation In Easy Excel Analysis and SQL Data Analysis, we just drag the Category column to the grouping area like this:

That is the reason why Easy Excel Analysis and SQL Data Analysis requires a period value when calculating NPV, IRR and XIRR.  It uses the values in that column to determine how to group the cash flow values when grouping rows together.

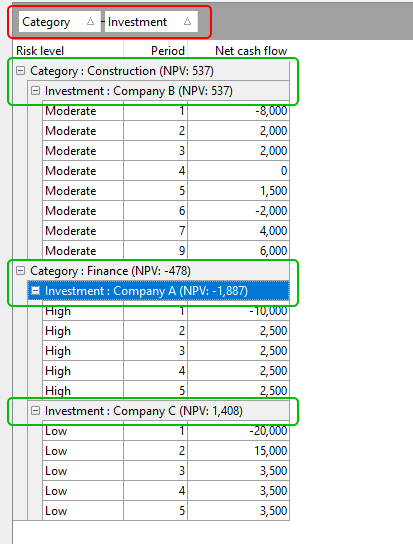
To see the NPV value by individual investments,  we just drag the Investment column to the grouping area.  Now we can easily see the NPV per category and per investment.

Thus it’s just a matter of dragging and dropping which columns you want to group by, and Easy Excel AnalysisSQL Data Analysis will calculate the NPV for you at each grouping level.  It could not be easier.

Download a 14-day trial of Easy Excel Analysis or SQL Data Analysis, and start analyzing data in ways you never could in Excel, or would never do because it was too time consuming.

Financial and statistical functions in Easy Excel Analysis and SQL Data Analysis

In Easy Excel Analysis and SQL Data Analysis 2, we added statistical and financial functions to the analysis tables.

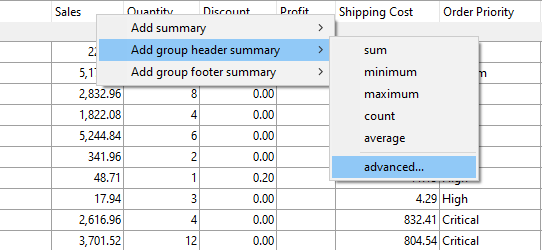
To use these functions, right click on the column header you want to compute to bring up the context menu.

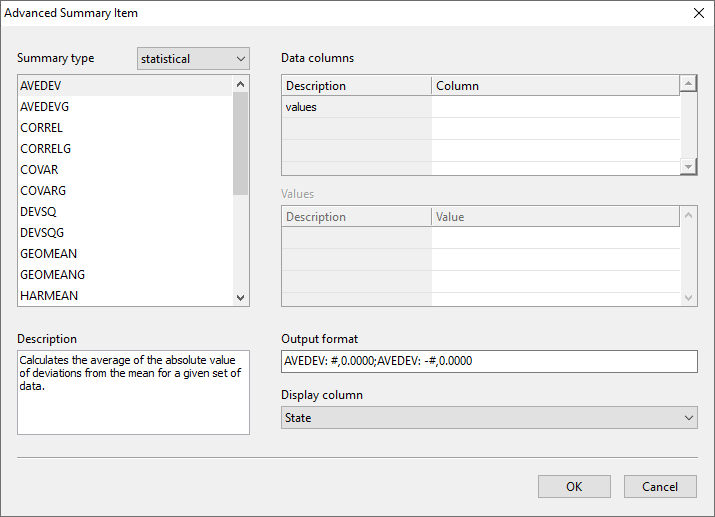
Select the advanced item.  This then brings up the Advanced Summary Item window where you can define the data source for the various parameters required for the function you select.

See also:


Search text in multiple PDF files fast

So you want to search for text in multiple PDF files?  You can do that in Adobe Acrobat, and Google will turn up a few guides on doing that.

That’s all good and fine, but what if you need the search results fast and you need to search hundreds or thousands of PDF files?  Then you should consider Easy PDF Search.

Speed

Easy PDF Search is fast.  Watch this video comparing Easy PDF Search with Adobe Acrobat.  In short, to search for a word the second in 46 files totaling 1 GB in size, Easy PDF Search took 3 seconds while Adobe Acrobat took 3 minutes 13 seconds.

We have a user who regularly searches his collection of over 12000 PDF files using Easy PDF Search, and he gets his search results in less than 20 seconds.

Search multiple words simultaneously

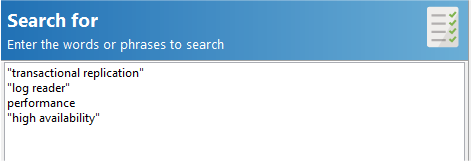
Search for multiple words simultaneously.  Why waste time searching the same files for different words?  Easy PDF Search lets you search for as many words or phrases as you require.

Quickly see where your words were found

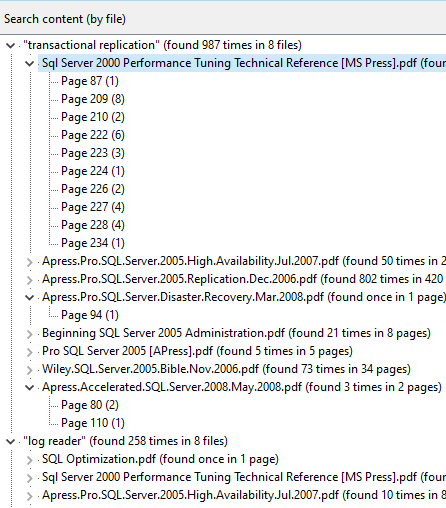
Easy PDF Search doesn’t just tell you which files your words were found in, it tells you exactly which page you can find the words in, and the frequency of the words on each page and the entire file.

In the integrated PDF viewer, all your words are highlighted on each page.

View results from past searches

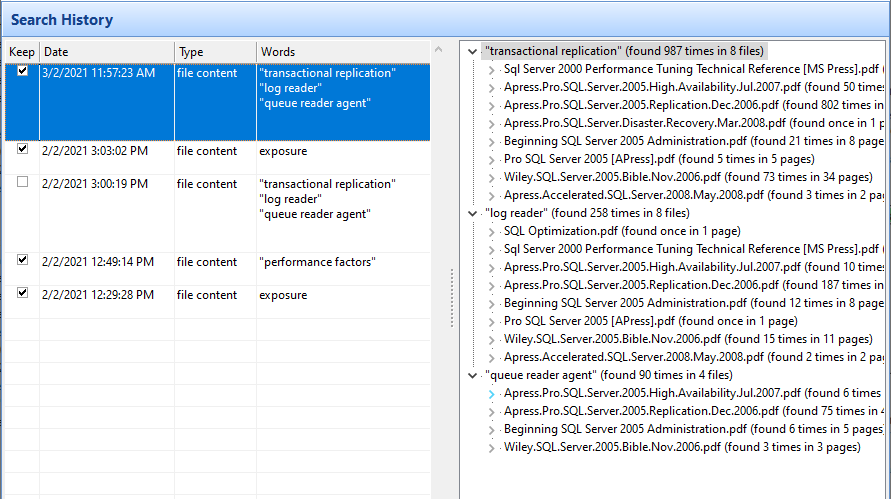
Easy PDF Search maintains a search history of the words you searched for and also of the search results.

This means you can easily view the search results from past searches without having to reperform the search.

By now, you can see that Easy PDF Search is designed to save you time and help you search for text in multiple PDF files fast and easily.

In addition to the above, there is a lot more you can do with Easy PDF Search like:

  • merge all the pages from the search results into a single PDF file
  • copy all the files in the search results
  • extract text from the pages where the words were found in
  • perform proximity searches e.g. NEAR (authorities “homeland security”, 20)
  • perform exclusion searches e.g. monitoring NOT daily
  • search PDF annotations and file attributes

Download a 14-day trial of Easy PDF Search and start using your PDF collection to their full potential, or visit our web site for more details.

Extracting attachments from an Access database using SQL Image Viewer

Access has a curiously interesting data type – attachment.

I say interesting because it does so much, but much of it is done behind the scenes.  To the user, it’s just so easy to attach one or or more files to that column.

For starters, some file types seem to be compressed automatically by Access.  I attached a 23 MB text file, and the database size only increased by 3 MB, which is about the size of what my text file would have compressed to.

Also, a single attachment-type column contains 4 sub-columns in them – FileName, FileType, FileData and FileURL (for Sharepoint databases).  These are the sub-columns we need to include in our query in SQL Image Viewer when we want to extract the files from the attachment-type columns.

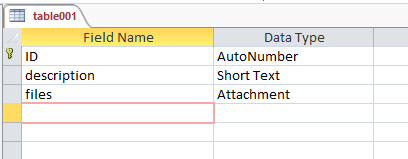
Say we have a table defined as such:

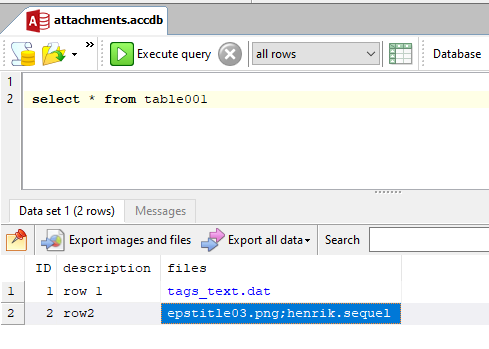
with the following data:

Row 1 has 1 attachment, and row 2 has 2 attachments.  If we run a query that selects just the 3 columns from the table in SQL Image Viewer, we get this:

The files column, which is the attachment-type column, displays only the names of the attached files, and is returned as a text column.  If however we selected the sub-columns:

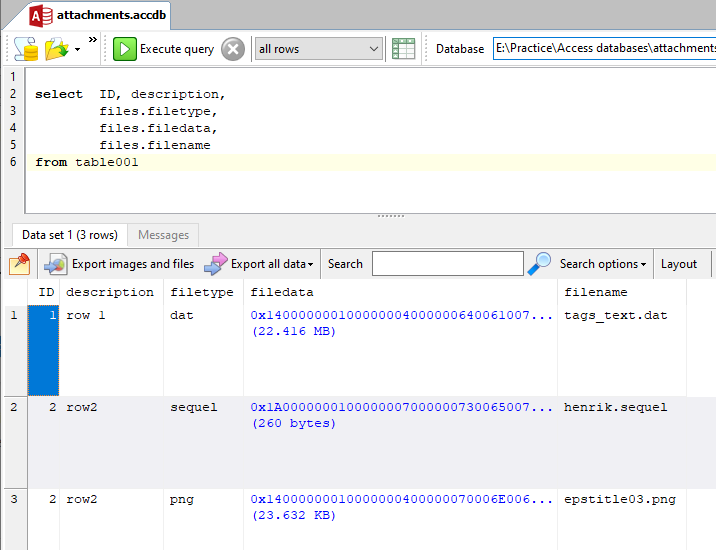
Access returns 3 rows instead of 2.  Because our 2nd row contained 2 attachments, Access returns 2 data rows, one for each attachment.

Thus, to extract the data from the attachment-type columns in SQL Image Viewer, we need to select the filedata sub-column of the attachment-type column.

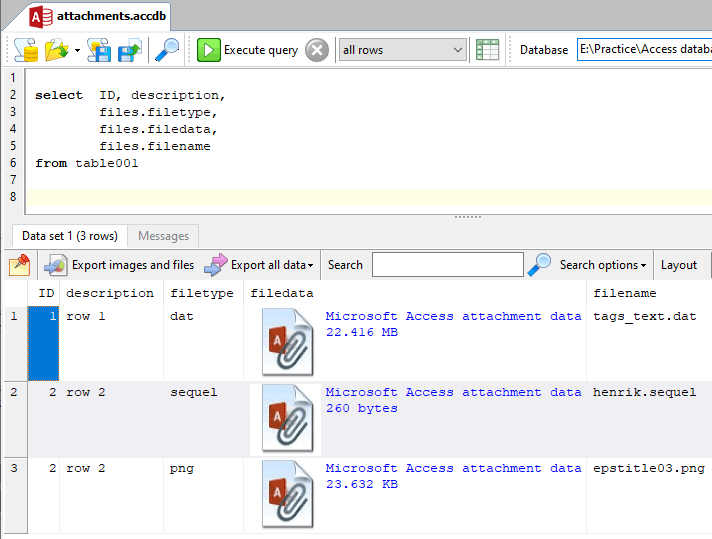
Since we added support for attachment-type columns in SQL Image Viewer 11, the same query above now returns this:

Download a 14-day trial of SQL Image Viewer now and experience how easy it is to extract attachments from your Access databases.

Extracting attachments from an Access table using Access OLE Export or SQL Blob Export

Access OLE Export 4 and SQL Blob Export 4 have added support to extract files from attachment-type columns in Microsoft Access tables.

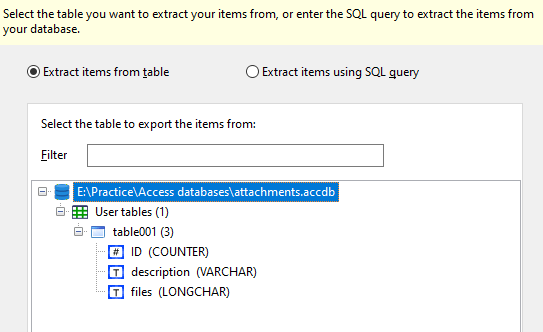
Say we have a table named table001 with the following structure:

Attachment-type columns in Access contain sub-columns that contains details of one or more attachments stored in that row.  If we just select the table during the export process like this:

Access OLE Export / SQL Blob Export (version 4.10 onwards) will automatically detect that the files column is a attachment-type column.  It will then retrieve the FileName, FileData, and FileType subcolumns, and export the content from the FileData column using the file name value from the FileName column.

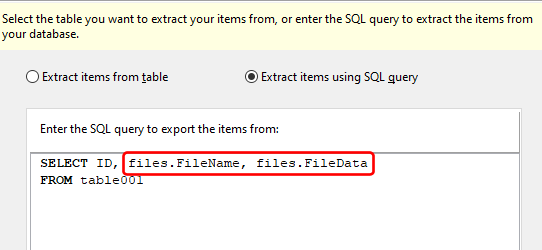
However, if you want to name the exported files differently, you will need to use the Extract items using SQL query option.  What we need to do is to enter a query to retrieve the sub-column (FileData) that contains the actual file contents.  The other useful sub-column is FileName, which stores the original file name.

We select the sub-columns by entering the column name (files), followed by a dot (.), then the sub-column name.  In the example above, to retrieve the contents of the attachment column, we enter

files.FileData

and to retrieve the original file name, we enter

files.FileName

Now if we want to, we can name the exported files using the original file name.  Enter

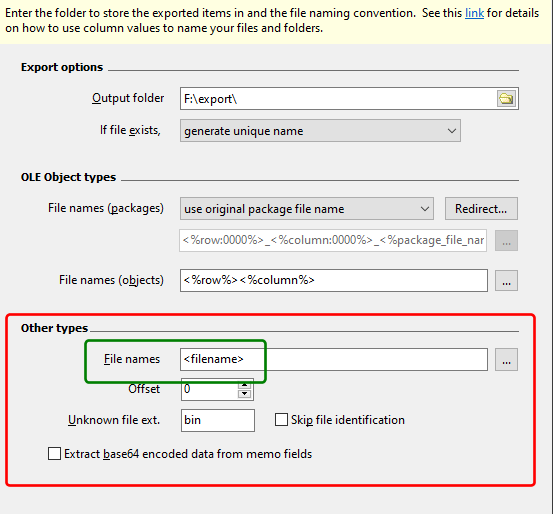
<filename>

as the column to use to name all the files that are exported, in the Other types section.

Access OLE Export or SQL Blob Export will then export each attachment returned by your query, and name the files using the original file names.  Of course, you can still use a different naming convention if you need to do so.

But say we want to add the ID value to the file name, as there may be duplicate file names.  We could then enter <ID>_<filename> for the file naming convention, and our exported files will contain the ID value.

We could further format the ID value to 4 digits, if we want it sorted neatly in Windows Explorer.  For e.g. instead of exported files named 1_contract.pdf, 2_invoice.pdf, 3_quotation.pdf, we could enter the naming convention value:

<ID:0000>_<filename>

and our exported files would be named 0001_contract.pdf, 0002_invoice.pdf, 0003_quotation.pdf

So if you have a ton of images that you need to export, give Access OLE Export or SQL Blob Export a try.