Tag Archives: Easy DICOM Viewer

Measuring regions of a similar color in DICOM images

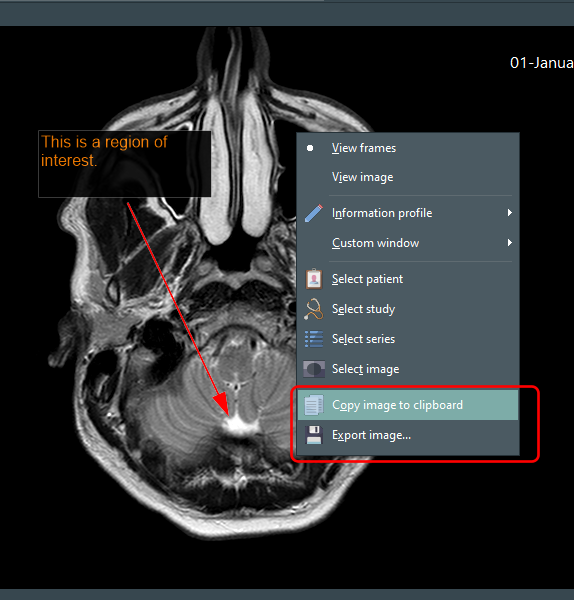
Easy DICOM Viewer  lets you measure regions of interest in your images using various options.  One such option is to measure the length and area of a region of similar color.

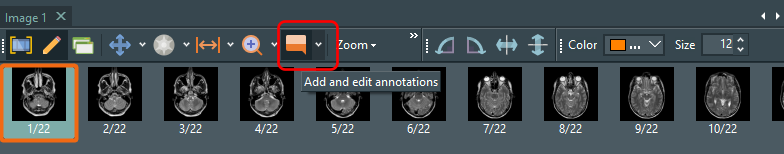
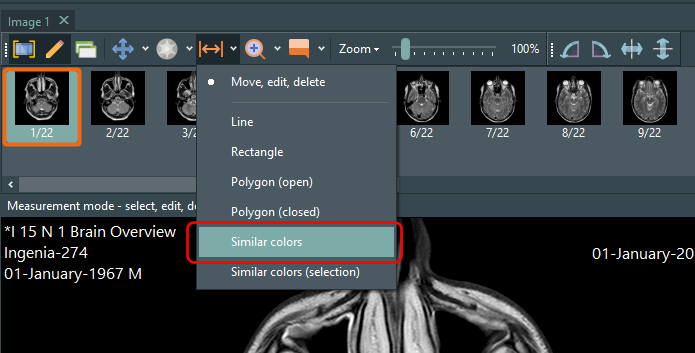
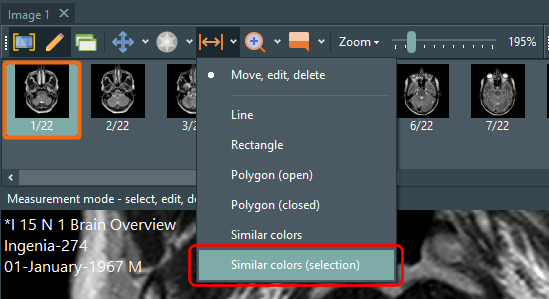
To use that option, first select the Similar colors item from the measurement sub-menu.

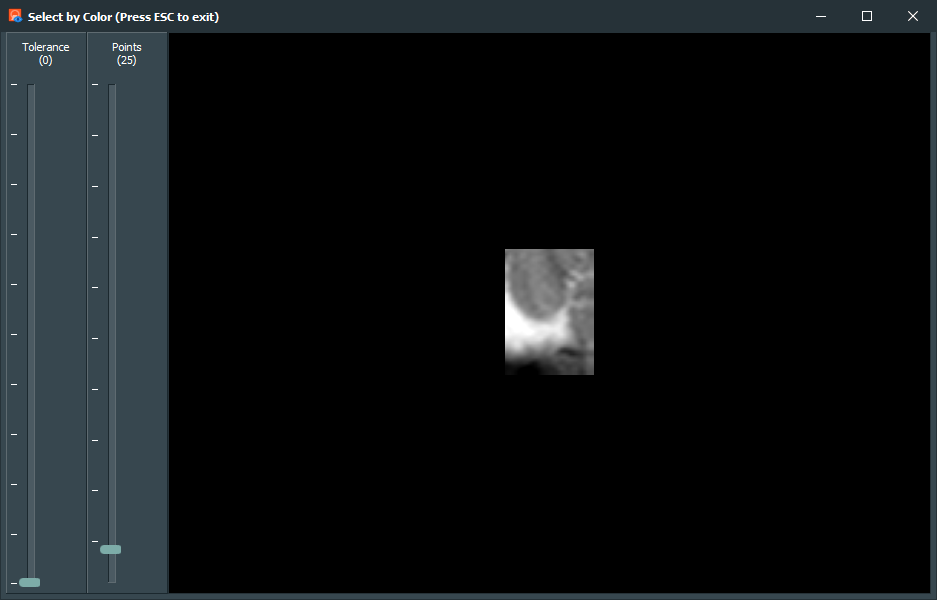
A new window is displayed where you first click on the point you want to measure.  You can zoom in and out of the image using the mouse wheel.

Let’s say we want to select the whitish region here.

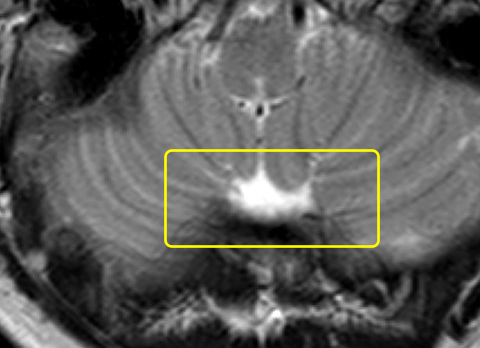
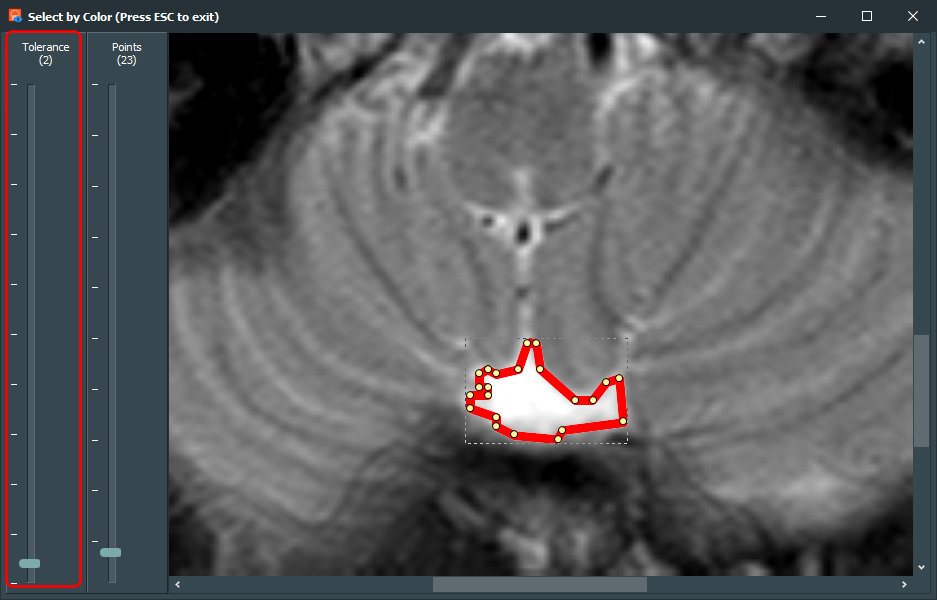
We first click anywhere in that region.  A polygon area is automatically created for us.

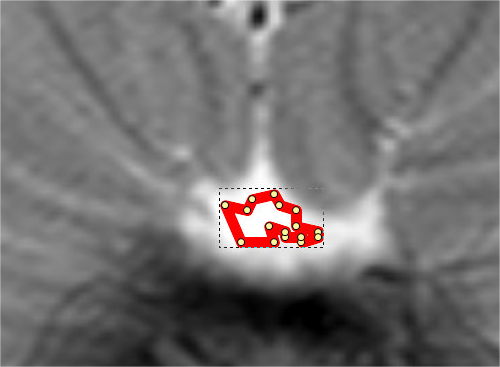
This initial selection contains only the area which has identical values to the point we clicked on.  To expand the selection to similar values, we adjust the tolerance slider on the left.

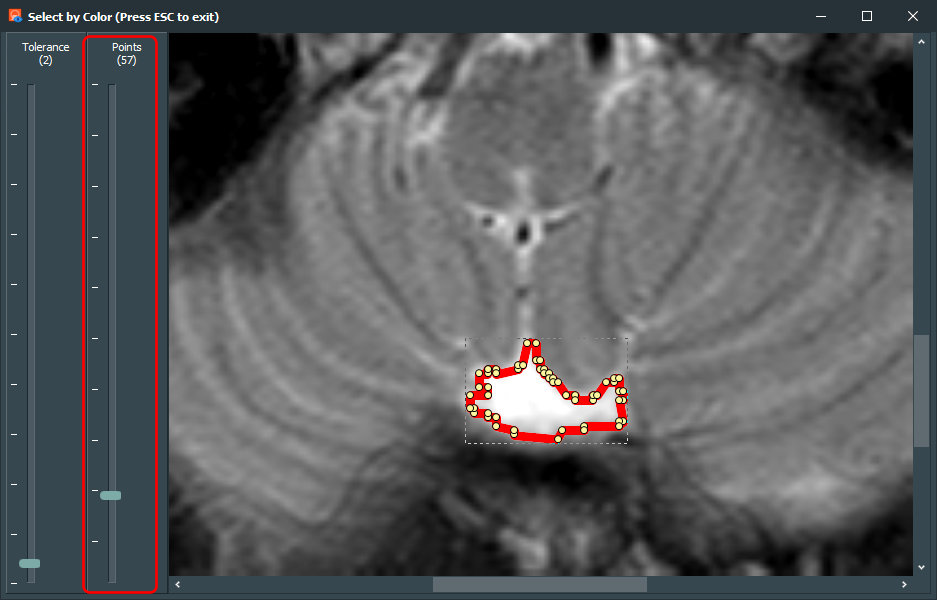
You can also adjust how smooth the shape is by adjusting the number of points used to form the selection.

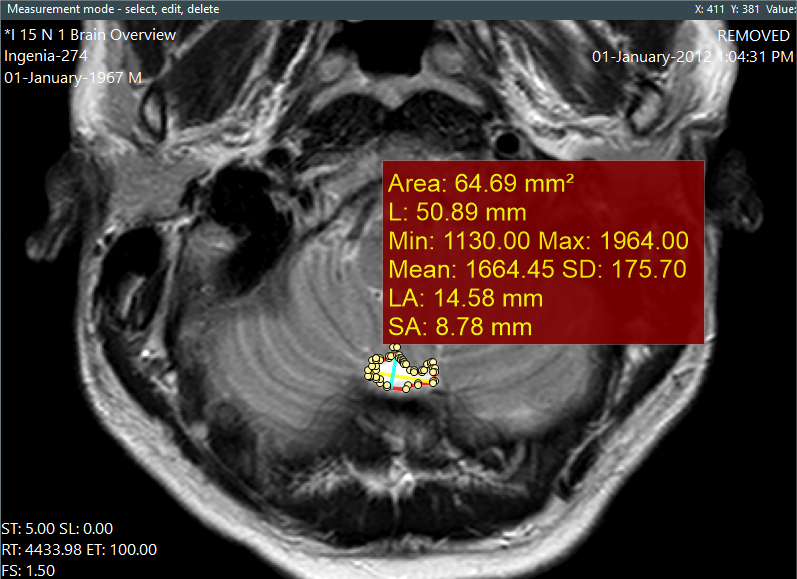
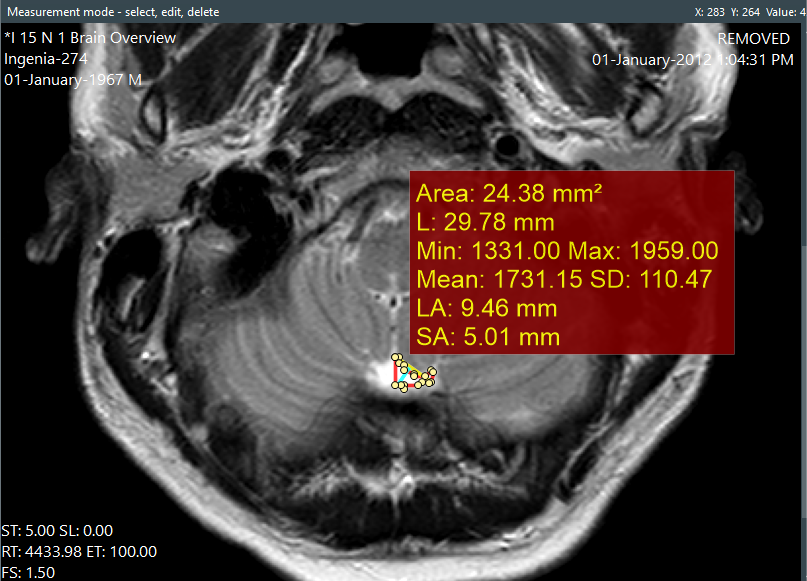
Once we have finalized our selection, press the ESCAPE key.  We then return to our viewing screen with our selection, and the measurements for area, length, minimum, maximum, mean and standard deviation of the HU values in the selected area are displayed, together with the length of the longest axis and the longest line perpendicular to the longest axis.

You can still adjust the selection area by dragging or deleting any of the existing points.  You can also add additional points to the shape.

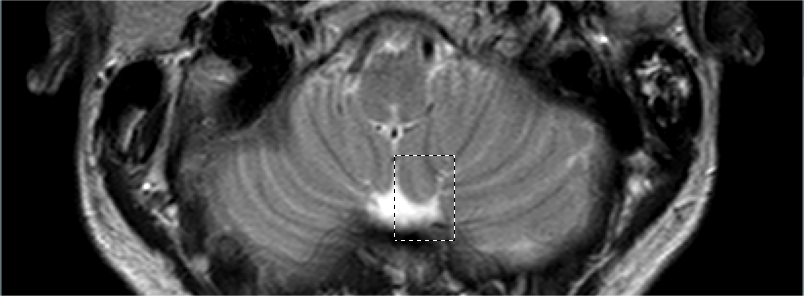
What if we only want to select part of the area with similar colors?  Let’s say we only wanted to measure the right side of the above region.  We can either adjust the shape after selecting the entire area, or we could use the Similar colors (selection) option.

The steps to select the region is identical to the Similar colors option, but you first define the region of the image you want to select from.  You do this by clicking and dragging the mouse to form a selection rectangle on the image, then release the mouse.

When you then enter the selection window, only the selected area is displayed.

Now we just need to click inside the area, adjust the tolerance values, and we’re done.  The selected area will be constrained accordingly in the final measurement.

Download a 14-day trial now of Easy DICOM Viewer and experience for yourself how easy it is to measure regions of similar colors in your DICOM images.

Easy DICOM Viewer is a collaborative effort between LISIT, Co., Ltd. and Yohz Software.  To learn more about Easy DICOM Viewer or download a trial, please use this link.  If you are in Japan, please use this link instead.

Viewing your DICOM images using the standard color palettes

In Easy DICOM Viewer, you can view your DICOM images using the standard color palettes easily – hot iron, hot metal blue, PET, PET 20 , and rainbow.

The fastest way to do that is by using the keyboard shortcut W.  When you first press W, you will enter the windowing mode.

When you are already in the windowing mode, pressing the W key again will cycle through the various color palettes.  In this way, you can easily apply the various color palettes fast.

You can also change the color profile using the sub-items of the windowing menu:

or from the context menu when in the windowing mode:

Download a 14-day trial now of Easy DICOM Viewer and experience for yourself how easy it is to apply the standard color profiles to your DICOM images.

Easy DICOM Viewer is a collaborative effort between LISIT, Co., Ltd. and Yohz Software.  To learn more about Easy DICOM Viewer or download a trial, please use this link.  If you are in Japan, please use this link instead.


Annotating your DICOM images

You can now add annotations to your images in Easy DICOM Viewer.  First, enter the annotations mode by clicking on the Add and edit annotations button on the toolbar, or use the keyboard shortcut (the T key).

In the DICOM image, right click to bring up the context menu, and select the Add text or Add line items.

Adding a text annotation

Click and drag anywhere in the image to create a text annotation.  You should see a rectangle with the words (annotation) displayed.

When you release the mouse, a bounding rectangle is displayed.

You can resize the annotation rectangle by clicking and dragging on any of the 6 yellow points.  You can also move the annotation by clicking and dragging inside the rectangle.  To change the text, double click inside the rectangle and write your text.

You can change the text color, size, and background color by changing the annotation settings on the toolbar.

Adding a line annotation

Click and drag anywhere on the image to create a line annotation.

You can click and drag on either point to change the start and end point of the line.   Adjust the line settings on the toolbar to change the line color and width.

Hiding annotations

If you don’t want to display the annotations temporarily, deselect the Display annotations item from the annotation mode button.

Deleting annotations

To delete an annotation, ensure that you’re in the annotation mode, then click on the annotation so that the bounding rectangle appears,  Press the DELETE key on the keyboard to remove the annotation.

Using the annotations

Annotations are automatically saved and displayed when you reopen the image.  You can copy the annotated images to the clipboard, or export the annotated images (PNG, JPG, BMP, GIF, etc) by selecting the appropriate action from the context menu.

Download a 14-day trial now of Easy DICOM Viewer and experience for yourself how easy it is to add annotations to your DICOM images.

Easy DICOM Viewer is a collaborative effort between LISIT, Co., Ltd. and Yohz Software.  To learn more about Easy DICOM Viewer or download a trial, please use this link.  If you are in Japan, please use this link instead.